
As several tech sector giants continued to deliver a mixed bag of earnings reports, MoneyShow’s Tom Aspray takes to the charts in search of long-term opportunities.
The stock market has surprised many pundits this week as the sharp drop at the end of last week had some fearing another round of selling this week. Monday’s late reversal suggested that the buyers, not sellers, were in charge. So far, the market has held up well, and though the ratio of advancing to declining stocks has been positive, they have not been stronger than prices.
The ratio was about 3 to 2 positive Tuesday and also closed positive on Monday. The McClellan oscillator has moved back above the zero line while the NYSE A/D line is quite close to making another new high. The S&P Case-Shiller Housing Price Index was positive, Tuesday, and Monday’s Pending Home Sales were stronger than expected.
Of course, the week is not over, and it is the weekly close that will be more important. A weekly close in the Spyder Trust (SPY) above $188.50 would be positive. Later today we have the ADP Employment Report and GDP, followed in the afternoon by the FOMC announcement. Then we have the monthly jobs report on Friday. The market has been focused on the individual earnings reports, which have been considerably better than expected.
After the close, the better-than-expected earnings from Twitter, Inc. (TWTR) still disappointed the market as its shares are down over 11% in early trading on Wednesday. Yelp, Inc. (YELP) reports after the close today.
Many are now reconsidering their view on Apple, Inc. (AAPL) after its strong earnings. It just completed a $12 billion bond offering that was met with over $40 billion in orders.
The market is also questioning its long-term outlook for Amazon.com Inc. (AMZN) as the stock price has plunged after its earnings report. As the month draws to a close, a look at the monthly charts of these two tech giants can help one identify long-term opportunities.
Click to Enlarge
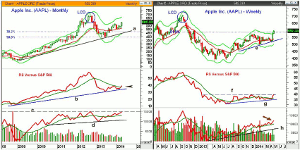
Chart Analysis: The monthly chart of Apple, Inc. (AAPL) shows the monthly low close doji sell signal that was triggered in October 2012.
- The stock eventually hit a low of $385.10 in April 2013, which was a 45% drop from its high.
- AAPL is ready to close the month strong and well above the December 2013 high of $571.72.
- The rising 20-month EMA in the $510 area was tested in early April.
- The quarterly projected pivot resistance at $594.33 has already been reached.
- For May, the monthly projected pivot resistance is at $651.20 with the monthly starc+ band at $662.70.
- The monthly relative performance appears to have held its long-term uptrend, line b.
- The RS line will close the month above its WMA.
- The monthly OBV moved above its WMA in July and then retested it in September (see arrow).
- The OBV is now very close to its all-time highs, line c.
The weekly chart of Apple, Inc. (AAPL) has overcome the major 61.8% Fibonacci retracement resistance at $579.64 this week.
- AAPL is currently trading well above the weekly starc+ band at $582.09; therefore, it is in a high-risk buy zone.
- There is next weekly resistance in the $613-$630 area.
- The monthly pivot for May is at $566.55 with further support at $549-$550.
- The quarterly pivot is at $528.07 and the weekly trend line support, line e, was tested three weeks ago with the low at $511.30.
- The weekly relative performance may complete its bottom formation this week as it is just above the key resistance at line f.
- The weekly on-balance volume (OBV) has made new rally highs over the past two weeks (see arrow) as it is well above the late-2012 highs.
- The OBV has long-term support, line h, well below current levels.
NEXT PAGE: Amazon’s Weekly & Monthly Charts
|pagebreak|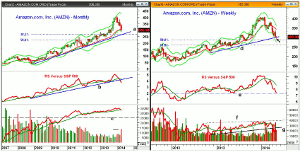
Click to Enlarge
The monthly chart of Amazon.com, Inc. (AMZN) reveals that it traded above its monthly starc+ band for the last three months of 2013 before reversing to the downside in January.
- With this week’s low of $288, it is down 29.4% from its high at $408.06.
- The 20-month EMA has been tested this month and it is at $286 for May.
- The major 38.2% Fibonacci support from the 2008 lows is at $265.14 as is the longer-term support, line a.
- The monthly relative performance made its high in November and confirmed the price action.
- In March, the RS line dropped below both its WMA and the support at line b.
- The monthly OBV has held up quite well but is likely to close below its WMA this month.
- There is long-term OBV support at line c.
- There is strong resistance now at $316-$322 as the quarterly projected pivot support at $309.35 has been violated.
The weekly chart of Amazon.com, Inc. (AMZN) shows that the support connecting the late 2012 and early 2013 lows, line d, was tested this week.
- This week’s low was very close to the 50% Fibonacci retracement support at $287.03, which is calculated from the late-2011 lows.
- The weekly starc- band is at $273.71 with the minor 61.8% retracement support at $245.75.
- The weekly RS line dropped below its WMA at the end of January and is now reaching long-term support at line e.
- The weekly OBV dropped below its WMA in January and then had a failing rally in the middle of March.
- The OBV dropped below longer-term support, line g, in early April and is now well below its declining WMA.
- The daily OBV (not shown) is negative but suggests we may have seen a selling climax on Friday and Monday.
- There is minor resistance on the weekly chart in the $308-$315 area.
What It Means: For Apple, Inc. (AAPL), the multiple time frame OBV analysis is clearly positive. The sharply higher opening last Thursday makes the risk very high at current levels. There needs to be some consolidation or a pullback to determine a buying zone where the risk can be controlled.
The high level of bearish sentiment on Amazon.com, Inc. (AMZN) and possible selling climax suggests that AMZN will not drop significantly below the recent lows. It has dropped between the minor 38.2% and 50% support levels, which is often a high-probability entry level.
Without new daily buy signals I have no official recommendation but aggressive traders could look to buy below $296 with a stop under the August 2013 low of $279.33. I will be looking for confirmation of a bottom before adding it to the Charts in Play portfolio.
How to Profit: No new recommendation


