Despite the recent plunge in gold prices, it appears that some individual investors are turning to silver, so MoneyShow’s Tom Aspray takes an in-depth look at the silver futures and two silver ETFs to see if they are on the right track.
The stock market closed mixed Wednesday with slight gains in the Dow Industrials and S&P 500 with the market internals just barely positive. The Dow Transportation and Dow Utilities closed slightly lower but the Philadelphia Semiconductor index lost 0.28%. The futures are a bit higher again in early trading.
For a change, the SPDR Gold Trust (GLD) was up 1.43% and the Market Vectors Gold Miners (GDX) was up an impressive 4.4%. Both are showing double digit losses for the past three months with GDX down over 32%.
The early September monthly OBV analysis favored another drop in these two ETFs. The technical outlook had deteriorated further as the month progressed and I suggested at the end of the month in 3 Things Gold Owners Should Know that investors should have a plan.
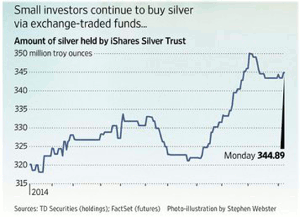
Silver is a market I do not generally write about when the technical outlook for gold is negative. Therefore, I read with interest today’s article in the Wall Street Journal Small Investors See Silver Lining, which discussed the sharp rise in the silver holdings of the iShares Silver Trust (SLV).
The chart from the article shows the dramatic rise in the ETF’s silver holdings since the start of the year as well as other evidence that suggests the individual investors are buying silver despite its recent sharp decline. Therefore, I thought it was a good time to take a look at both the silver futures as well as two silver focused ETFs to see if they are on the right track.
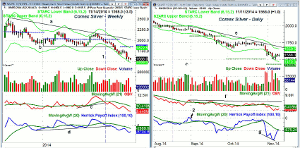
Chart Analysis: The weekly chart of the Comex Silver futures shows the completion of the trading range, lines a and b, in September.
- This break took prices below the opening price in 2014 at $20.08.
- The width of the range has downside targets at $1650 and then in the $1300 area.
- The weekly starc- band was tested last week and is now at $1488.
- The quarterly projected pivot support is at $13.73.
- The weekly OBV dropped below its WMA and then violated support, line c, on August 15 (line 1).
- Below the OBV I have included the Herrick Payoff Index (HPI), which uses volume, open interest, and price to determine money flow.
- The HPI also turned negative in August and—like the OBV—has made lower lows, which is not consistent with a market low.
- There is first strong weekly resistance at $17.80 with the quarterly pivot at $18.51.
The daily chart of the Comex Silver contract can help one determine the near term path for silver prices.
- Silver prices had moved sideways for most of October, which is typical of a continuation pattern, which is a pause in a trend.
- The downside break on October 30 signaled that the downtrend had resumed.
- The daily starc- band has been violated several times already this month.
- The monthly projected pivot support is now at $14.33.
- The volume has increased over the past several weeks.
- Last month’s flat action in the OBV was negative and it has confirmed the new lows.
- The daily HPI dropped to new lows in July (not shown) indicating money was flowing out of silver.
- The HPI briefly moved back above zero in late August but then reversed (see arrow).
- The HPI has formed lower lows on the recent decline (line g), which confirms the price action.
- There is initial resistance at $16 and then $16.43 and the declining 20-day EMA.
NEXT PAGE: Two More Silver Focused ETFs to Watch
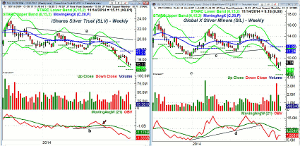
|pagebreak|The iShares Silver Trust (SLV) has net assets of $5.55 billion with an expense ratio of 0.50%. It is down 19.24% YTD and 21.2% in the past three months.
- The weekly chart shows that it traded in a broad range for a good part of 2014 before breaking to the downside (see arrow).
- Three weeks later, the weekly starc- band was tested.
- This was followed by a three-week bounce before SLV continued its decline.
- The starc- band was tested again last week and is now at $14.55.
- The monthly projected pivot support is at $14.05.
- The volume has been the heaviest over the past three months.
- The weekly OBV dropped below its WMA on August 8 with support broken one week later.
- There is initial resistance at $15.50 to $15.76 and the declining 20-day EMA.
- The quarterly pivot is at $17.72 and SLV has been below the quarterly pivot since early August.
The Global X Silver Miners (SIL) has total assets of $185 million with an expense ratio of 0.65%. It has 25 holdings in the portfolio with over 64% in the top ten holdings.
- SIL is down 18.04% YTD and has dropped over 36% in the past three months.
- The chart shows that SIL closed below support, line c, on September 19.
- It has dropped 19% since this break with the weekly starc- band at $7.81.
- The monthly projected pivot support is at $7.01.
- The weekly OBV broke its support (line d) one week ahead of prices.
- It has tested its flat WMA one week before it dropped below support (see arrow).
- The OBV has made lower lows with no signs yet of a bottom.
- The daily OBV (not shown) is also negative.
- The 20-day EMA is at $9.45 with stronger resistance at $10.30-$10.50.
What it Means: The weekly and daily analysis of the silver futures—along with the two silver focused ETFs—is still negative and shows no signs yet of a bottom.
I will be watching the futures closely for signs that indicators like the HPI have turned positive. It does seem that the individual investors are a bit early but several of those that were quoted have a long-term plan.
How to Profit: No new recommendation.


