Individual investors who continue to stay on the sidelines are likely to miss out when the major averages breakout to the upside, so MoneyShow’s Tom Aspray takes a technical look at key ETFs to identify profit taking levels and to be sure stops are correctly placed.
Tuesday’s early weakness was met with good buying on the back of gains in JP MorganChase (JPM) in reaction to its positive earnings. The Market Vectors Semiconductor ETF (SMH), a focus of yesterday’s column, closed the day lower, but Intel Corp. (INTC) rallied after the close as it beat earnings.
The energy sector led the market as the Sector Select Energy (XLE) was up 1.80%. This was consistent with the continued rally in crude oil. In the early April article Can Crude Turn in the 2nd Quarter? I reviewed the improving technical outlook for crude oil.
Most evidence suggests individual investors continue to stay on the sidelines and this means they are likely to miss out when the major averages breakout to the upside. The market internals were stronger than prices on Tuesday which is a positive sign.
The daily seasonal pattern for the S&P 500 is typically very positive until the first week of May, but with the lackluster YTD performance of the S&P 500, it could last longer this year.
Our long positions in the Spyder Trust (SPY) and iShares Russell 2000 (IWM) were established during the pullback in January, while the PowerShares (QQQ) was bought more recently. Now is the time to identify the initial profit taking levels for these key ETFs and to be sure the stops are correctly placed.
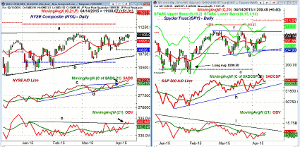
Chart Analysis: The NYSE Composite (NYA) held up well Tuesday and is still trading near its recent highs.
- A strong close above the resistance at line a, should signal a move to the monthly pivot resistance at 11,347.
- The weekly starc+ band at 11,459 and the quarterly projected pivot resistance at 11,527 are additional upside targets.
- There is initial support and the 20-day EMA at 10,997.
- The chart has more important support and the quarterly pivot at 10,828.
- The NYSE Advance/Decline line broke through resistance, line c, on April 2.
- It is positive that the A/D line is well above its rising WMA.
- The daily OBV broke through the resistance from last January, line e, last Friday.
- The OBV’s short-term zig-zag formation is positive.
The Spyder Trust (SPY) is still in its trading range, lines f and g, from late February. Longs were recommended in a January 16 Tweet.
- On an upside breakout, the 127.2% Fibonacci target is at $213.27.
- The monthly pivot resistance is at $214.64.
- The upside target from the trading range is in the $218-$220 area.
- The rising 20-day EMA at $207.99 was tested yesterday with more important support in the $205 area, line g.
- The S&P 500 A/D line made a marginal new high last Friday.
- The A/D line is above its WMA with longer-term support at line h.
- The OBV on the SPY is still lagging as it has just moved barely above its WMA.
- The OBV has longer-term resistance at line i.
Next: Two More Moving Averages to Watch
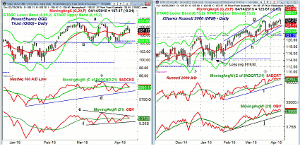
|pagebreak|The PowerShares QQQ Trust (QQQ) held its 20-day EMA at $106.63 but still closed a bit lower.
- There is further support now at $105.50 with the quarterly pivot at $104.63.
- The key resistance is at $109.07, line a, with the monthly pivot resistance at $111.27.
- The trading range, lines a and b, has upside targets in the $113-$114 area.
- The quarterly projected pivot resistance is at $114.67.
- The Nasdaq 100 A/D line failed to make a new high last week, line c.
- A strong close above this A/D line resistance is needed to signal upside acceleration.
- The daily OBV has also formed lower highs, line e, and closed Tuesday just slightly below its WMA.
- There is more important OBV support now at line f.
The iShares Russell 2000 (IWM) has been leading the other market averages higher as it is up 5.34% YTD.
- The daily starc+ band is at $128.07 with the monthly pivot resistance at $129.73.
- The quarterly projected pivot resistance is at $133.48 with the upper boundary of the trading channel (line g) a bit higher.
- The 20-day EMA is now at $124.41 with the uptrend, line h, just a bit lower.
- The quarterly pivot is at $121.39 with the monthly pivot support at $120.58.
- The Russell 2000 A/D line shows some loss of upside momentum but is still above its WMA.
- The daily OBV made a sharp new high in March and is now just below those highs.
- The WMA is flattening out but the OBV has stronger support at line j.
- The weekly OBV (not shown) has made a convincing new high and is acting stronger than prices.
What it Means: After February’s rally, I was expecting an upside breakout but instead the Spyder Trust (SPY) and Powershares QQQ Trust (QQQ) have stayed within their trading ranges. The IWM has done much better.
The stops have been kept wide in an effort to stick with the intermediate-term trend. The next rally I think will be an opportunity to take some partial profits while keeping stops wide until there are signs of a more significant correction.
How to Profit: No new recommendation.
Portfolio Update: Traders are 100% long the iShares Russell 2000 (IWM) at an average price of $115.92. Sell ½ the position at $129.32 or better and use a stop at $119.17.
Traders are 100% long the Spyder Trust (SPY) at an average price of $200.50. Sell ½ at $214.16 or better. Raise the stop to $203.88. On a move above $212, raise the stop further to $206.83.
For the PowerShares QQQ Trust (QQQ) should be 100% long at $106.73 with a stop at $102.12. On a move above $109, raise the stop to $104.13. Sell ½ at $113.17.


