Technician Corey Rosenbloom, of AfraidToTrade.com, highlights four companies that are currently swimming against the broader market's tide by pushing to brand new 52-week lows and suggestsit’s often best to trade in the direction of money flow—trend—as opposed to fighting it.
“What gets weak tends to get weaker; what gets strong tends to get stronger.”
Which four stocks in the US Dow Jones Industrial Average are really weak right now, so weak that they are downtrending and pushing to brand new 52-week lows?
Let’s highlight four companies that are swimming against the broader market’s tide (and may continue to do so).
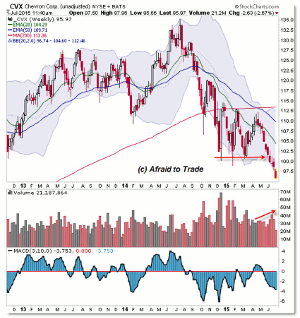
In alphabetical order, we’ll start with Chevron (CVX):
What was weak before is still weak today. In an earlier post, I highlighted Chevron (CVX), Wal-Mart (WMT), and Exxon-Mobil (XOM).
Today, I’m highlighting Chevron, Wal-Mart, and Exxon-Mobil again, along with a new weak addition of Coca-Cola (KO).
The purpose of this scan is to determine weak stocks likely to get even weaker, which means our strategies should favor bearish tactics, not bullish reversal strategies (which are tempting).
Nevertheless, Chevron broke support above the $100 level and extended the downtrend, collapsing toward the current $96.00 level.
It’s striking to note that Chevron—a Dow Jones component—has traded 11 weeks consecutively to the downside.
That which is weak tends to get weaker.
Keep this logic in mind when viewing a similar Energy/Oil company Exxon-Mobil later.
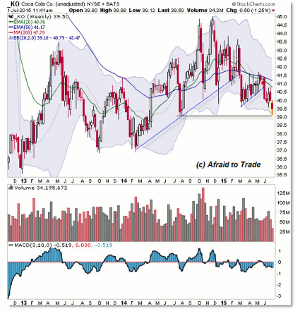
Next up alphabetically is Coca-Cola (KO):
This might be a surprising addition to the Weak Getting Weaker list, but nevertheless, Coke is downtrending (down from the $45.00 peak in 2014) toward the current focal point of $39.00 per share.
A further breakdown under $39.00 suggests additional weakness and bearish movement down toward $37.00 or lower.
For now, focus on the critical pivot support—and 52-week low level—near $39.00 per share.
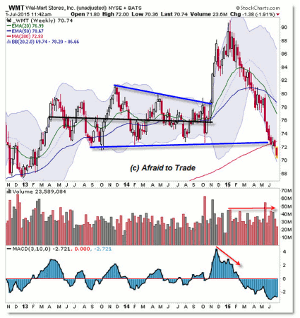
Wal-Mart (WMT) extends its weakness from $90.00 to $70.00:
Wal-Mart WMT showed a Rocket Arc price pattern, which is similar to what I highlighted in an ETF post earlier in the week.
Rocket Arc patterns start with a blast-off higher (late 2014) that ends with a peak ahead of a fall back to earth or reversal swing lower that is similar to the rally.
Wal-Mart demonstrates this pattern in 2015 with a stellar rise…and even stronger reversal.
Wal-Mart is now trading at price levels not seen since early 2013…and could trade even lower if sellers push price under the $70.00 per share level.
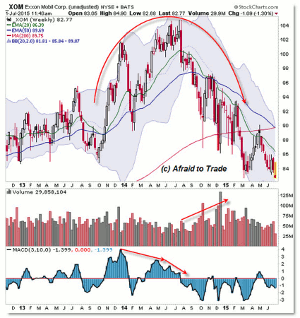
Finally, we have Exxon-Mobil (XOM):
Like Wal-Mart and the other examples in the Rocket Arc post, Exxon-Mobil similarly blasted off through 2014 and then returned to earth in 2014.
The downtrend continues and has taken price to new lows not seen since 2012.
Resist the urge to fight trends and call bottoms in weak stocks—there’s a reason money is flowing out of these names and it’s often best to trade in the direction of money flow—trend—as opposed to fighting it.
By Corey Rosenbloom, CMT, Trader and Blogger, AfraidToTrade.com


