
The company has been as steady as anyone could hope, but that doesn’t mean it’s always a good time to buy, especially if you’re just looking at price charts, observes Julie Carnevale of FASTgraphs.com.
After examining McDonalds’ (MCD) history over several different time frames, we learn that this company has a very consistent record of growing earnings at double-digit rates. Moreover, we also learned that “Mr. Market” has shown a penchant of pricing McDonalds’ shares within reasonable variations of its earnings achievements.
However, it’s now time to look to the future in order to answer the question posed by the title of this article: whether or not McDonalds is too rich to buy or hold at today’s prices.
So utilizing our Estimated Earnings and Return Calculator, let’s start by looking at our default estimates based on the current consensus of 19 analysts reporting to Capital IQ.
Here we discover two things that we believe are important. First of all, the consensus of leading analysts expects McDonalds’ earnings to only grow at a below historical average rate of 10% per annum over the next five years.
Moreover, the consensus for calendar year 2012 is for earnings to only grow at 9% before moving on to the average five-year growth estimate of 10%. Based on McDonalds’ past history, we feel it’s logical to assume that there might at least be a moderately negative bias to current estimates.
This seems even stranger when you consider that on January 24, McDonalds reported fourth-quarter 2011 earnings growth of approximately 15%, and the same number for all of calendar year 2011 (note that our graphs are only showing 2011 earnings growth of 14%, marked with an "E" for estimate, as the official data has not yet filtered through the database).
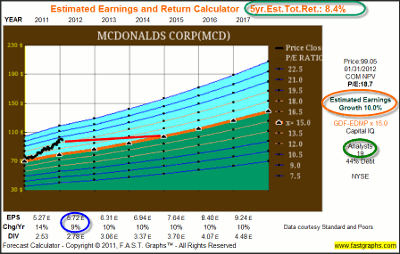
Click to Enlarge
Assuming that consensus estimates are correct, it would appear that McDonalds’ shares are currently moderately overvalued (share price more than two years ahead of earnings—red line).
The four lighter colored orange lines, two above and two below the darker orange line, represent what we like to call the value corridor. Notice that the lines are all parallel to each other and sloped at the estimated growth rate of 10%.
Also, the appropriate P/E ratios that apply to each of the lines are listed on the scale to the right of the graph. Therefore, the calculated five-year estimated total return of 8.4% per annum assumes that McDonalds does in fact grow earnings at the consensus rate of 10%, and that the market appropriately capitalizes that growth at a P/E of 15.
|pagebreak|However, when you consider that McDonalds has grown earnings at 15.7% since calendar year 2007, and that their earnings growth in 2011 was also 15%, the consensus estimate of only 10% seems low.
Therefore, utilizing the override feature of the Estimated Earnings and Return Calculator, we will recalculate our expectations for McDonalds’ five-year estimated future growth using their 15.7% historical average. In other words, we are asking “what if” McDonalds continues to grow earnings as it has in the past.
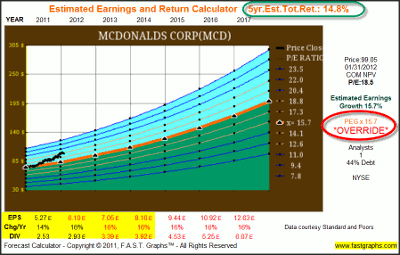
Click to Enlarge
When we redraw the chart using these numbers, we discover that McDonalds may still currently be fully valued where its price is now sitting near the top of the value corridor (the top light orange line).
However, we believe it would be a stretch to call it overvalued at today’s price levels. Considering that if McDonalds was to continue achieving its historical growth, then the potential for a total annual return of approximately 15% or better becomes very real.
Unfortunately, most investors are forced to rely on charts based solely on stock price in order to determine whether the stock is a good buy, sell, or hold. Consequently, it’s very easy to become misled by either a rapidly rising or rapidly falling stock price.
We believe that the only way to really have a clear vision of the appropriateness of investing in any given stock is when price and fundamentals can be viewed simultaneously.
When you examine the 20-year earnings (fundamentals) and price correlated graph on McDonalds, the relationship between fundamentals and stock price can be vividly seen. Therefore, more appropriate buy, sell, or hold decisions can be made based on a sound foundation of fundamentals. This is not to imply that perfect decisions can be made, but we believe it is clear that when price and fundamentals are viewed in concert with each other, a more learned perspective is attained.
When applying these principles to McDonalds’ current valuation, it appears that McDonalds’ stock is currently fully priced…but once again, we would stop short of calling it overpriced. Although we would not purchase McDonalds’ stock at today’s prices, we only make that decision based on the belief that sometime in the near future we might be given the opportunity to invest in this blue-chip at a better valuation.
This opinion is founded upon the principles of valuing earnings, and the long-term history of how the market has specifically valued McDonalds’ earnings. Consequently, we currently rate McDonalds a long-term hold.
Read more from FASTgraphs.com here…
Related Reading:


