While closely monitoring market action for clues about what lies ahead, more aggressive traders can look to profit from ETFs tracking the tech sector and gold.
The stock market was hit with many negatives this week, including weaker-than-expected durable goods and GDP numbers. Overseas developments were not much better, with continuing debt concerns in the Eurozone threatening to spread as the International Monetary Fund (IMF) has threatened to withhold its next payment on Greece’s bailout.
There are also further concerns over the state of the Chinese economy, as the Shanghai Composite has closed lower for the past seven days and was down over 5% this week.
As if this was not enough, crude oil is back over $100 per barrel and gas prices are uncomfortably close to $4 per gallon as we head into the Memorial Day weekend. After last year, the “Sell in May and go away” crowd is vowing not to be caught with too many stocks in their portfolios—like they had last year.
The technical outlook for the stock market is different from last year considering that in April 2010, the weekly NYSE Advance/Decline (A/D) line had formed a bearish divergence, but this year, no divergences are currently evident. (See Market Timing 101 for more.) The daily A/D line made new highs in early May and has pulled back to stronger support this week.
I believe the market behavior on Wednesday and Thursday was especially important, as the stock index futures were under pressure in early trading, but on both days, stocks rebounded to close higher.
Sentiment has also reached bearish extremes, as the American Association of Individual Investors (AAII) reported the number of bulls dropping to 25% on Thursday. This was the lowest reading since the August 25, 2010 reading of 20.74% bulls.
Analysis of the Commitment of Traders (COT) data on the stock index futures by COT expert John Person shows that as of last week, the small speculators are heavily positioned on the short side. Person further points out that historically, these small speculators have generally been short at market bottoms and long at market tops.
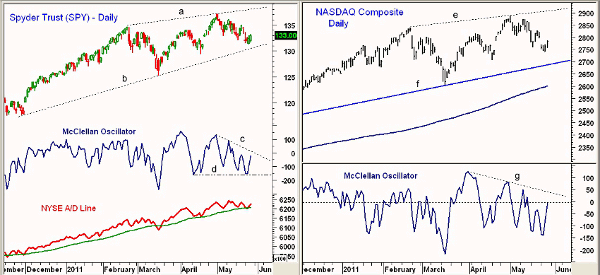
Chart Analysis: The daily chart of the Spyder Trust (SPY) shows the higher closes over the past two days, as SPY is still holding above the April lows and the daily uptrend in the $129.50-$130.50 area.
- SPY has initial resistance at $134.50-$135 and a close above this level would be a short-term positive
- There is additional resistance above $136 with the daily trend line resistance at $138
- The McClellan Oscillator, a short-term A/D indicator, has turned up from the -150 level (line d) and is likely to move above the zero line and resistance at line c with positive A/D numbers on Friday
- The NYSE A/D line has turned up from its weighted moving average (WMA) and is close to breaking through short-term resistance
The Nasdaq Composite gapped lower on Monday, but edged higher on Thursday and is close to filling its gap. A move above last week’s highs at 2828 will be the first sign that the correction is over.
- There is more important resistance in the 2885-2911 area, line e
- The McClellan Oscillator for the Nasdaq has also turned up sharply from oversold levels and is just barely below the zero line. It would turn positive on a move through the resistance at line g
- On a move above the zero line, this oscillator will typically move to the +100 to +200 level
- There is initial support for the Nasdaq at 2744 and then at 2706 and the April lows
NEXT: Aggressive Contrarian Plays in Gold, Technology
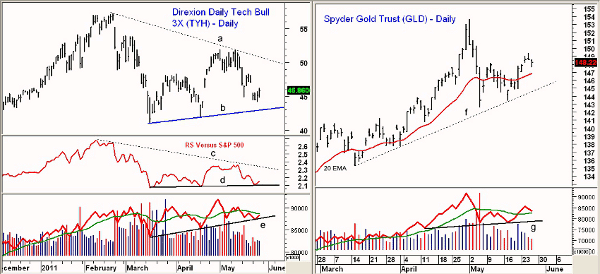
|pagebreak|The Direxion Daily Technology Bull 3x Shares (TYH) closed Thursday above the highs of the previous three days with further resistance at $47.06-$48.24.
- The daily downtrend, line a, is in the $50.74 area with additional resistance at $51.50
- The relative performance, or RS analysis, is trying to bottom out (line d), and a move through the downtrend, line c, would signal that it is outperforming the S&P 500
- The daily on-balance volume (OBV) made new highs in early May, as it was acting stronger than prices. It has not turned up from support at line e
The sentiment picture for gold also seems to have also shifted following the recent plunge in silver. This may be enough to push the SPDR Gold Trust (GLD) to new highs. Gold prices did make new highs in euro this week, which is a positive sign. On Monday, I commented on GLD, but the recommended buying zone was not hit. GLD has since moved higher and almost reached the 61.8% retracement resistance at $149.55.
- If GLD can close above $150, a move to the prior highs at $153.61 is likely with the 127 .2% retracement resistance target at $156.90
- The daily on-balance volume has turned lower and is approaching its rising weighted moving average. There is good OBV support at line g
- There is now initial support for GLD at $147.80 and then stronger support in the $146.20-$147 area
- The rising 20-day exponential moving average (EMA) is at $146.80 with the daily trend line support at $144.80
What It Means: A higher market close on Friday with positive A/D numbers will increase the odds of a stronger rally next week. If stocks instead close lower on Friday, then we may have to wait until early next week before the market turns around.
Certainly, the technical and sentiment measures favor the long side, and the technology sector is likely to outperform if stocks move higher.
Aggressive traders should consider taking positions in both TYH and GLD, but I do recommend reducing the positions as they move higher.
How to Profit: For the Direxion Daily Technology Bull 3x Shares (TYH), buy at $45.62 with a stop at $43.91 (risk of approx. 3.7%). Sell half the position at $47.94 (for a 5% gain) and raise the stop to $44.90.
My prior recommendation in SPDR Gold Trust (GLD) was not filled. Traders could now look to buy GLD at $147.44 with a stop at $144.64 (risk of approx. 1.9%). Sell half the position at $150.66 and raise the stop to $146.87.


