Technical indicators show that a major market top is not in place, but as fears mount and the carnage continues, here are the critical risk factors to watch…and a few safe buys as well.
If we took a poll this morning, amid the backdrop of sharp declines in Asian markets and the riots in Greece, I suspect a clear majority would now say yes, the bull market is over. Tuesday’s sharp gains gave the bulls some hope, but it was short-lived, as stocks were hammered again on Wednesday.
Those looking at the recent fundamental data can certainly make a case for further economic weakness and the possibility of another recession. Early in my career, I came to the conclusion that investing or trading based on fundamental analysis did not work and that technical analysis will often give advance warning of fundamental developments.
The only thing that I see on the horizon that could cause another financial crisis is if Congress fails to raise the debt ceiling.
The average investor may not realize the important impact that psychology can have on the markets. I believe the initial vote against the rescue plan in October 2008 created a crisis in confidence, and by the time it passed later in the week, the damage was already done. Even a momentary loss of confidence in US debt could have lasting implications.
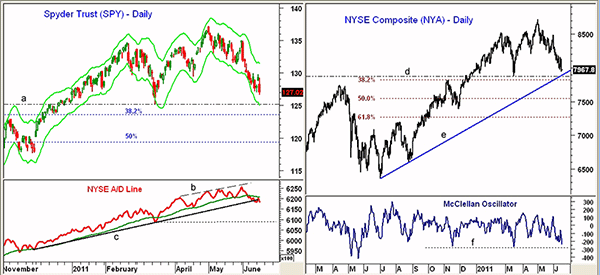
Though I was certainly not expecting such a deep market decline, it is important to realize that the Spyder Trust (SPY) has not yet retraced 38.2% of the rally from the June 2010 lows. Even in a healthy uptrend, corrections of 38%-50% are quite normal.
Let’s take a look at some of the other technical indicators and what they are currently telling us about the health of the stock market.
Chart Analysis: The daily chart of the Spyder Trust (SPY) shows the next widely watched support level at $125.28 (line a), which corresponds to the March lows. The daily Starc- band is just below $125 with the weekly band (not shown) at $124.30.
- The 38.2% support is at $123.60 with the May 2010 highs at $122.05. The more important 50% support level is at $119.40
- Major 38.2% support from the 2009 lows is at $110
- SPY has initial resistance at $129-$130 with much stronger at $132-$133.50
- Both the NYSE daily Advance/Decline (A/D) line (line b), and more importantly, the weekly A/D line (not shown) made new highs alongside SPY in early May. This is consistent with a positive major trend
- The daily A/D line has broken its uptrend from the November lows, line c, but is still well above the March lows. It is still acting stronger than prices, but it would take several days of three-to-one or better A/D ratios to turn it around
The NYSE Composite is a broader measure of the stock market and is still 1% above the March lows (line d). The 38.2% support is at 7800, about 2% below Wednesday’s close.
- The uptrend from the lows of summer 2010, line e, coincides with the March lows, while the 50% support is at 7550, which is about 5.8% below current levels
- The McClellan Oscillator, a short-term A/D indicator, bounced up to -62 on Tuesday, but it closed Wednesday at -158. At the March lows, it was at -417. It will often form positive divergences at correction lows.
NEXT: The Event That Could Sink the Markets
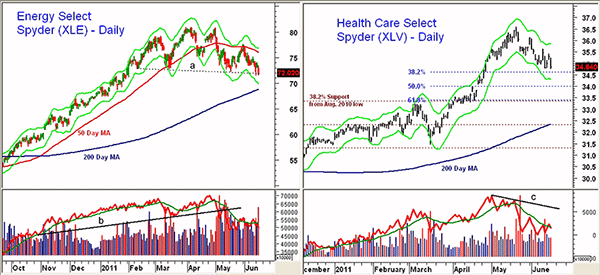
|pagebreak| The sharp drop in crude oil is my main concern about the markets right now. As I noted on May 12 (see “Big Oil’s Big Top”), the Select Sector SPDR - Energy (XLE) had completed a head-and-shoulders top formation.On Tuesday, the August crude oil contract closed well below the important support at $96, thus completing the continuation pattern. XLE has violated the support at $72 over the past two days, and a close below $71.48 is likely to put more downward pressure on the stock market.
- The daily Starc- band for XLE is at $70.25 with the rising 200-day moving average (MA) at $68.80
- Initial targets from the top formation are in the $70 area with more aggressive targets at $65-$66.40 and the major 50% support
- The daily on-balance volume (OBV) broke its uptrend, line b, in May and continues to act weak. The weekly OBV (not shown) formed a negative divergence at the highs
- Resistance is now at $73-$74 with the declining 50-day MA at $76.06
The Select Sector SPDR - Health Care (XLV) peaked in mid-May at $36.44 and closed Wednesday just above the 38.2% retracement support level at $34.60.
- 50% support is at $34, while the short-term 61.8% support and the 38.2% support from the August 2010 lows converge at $33.40
- The rising 200-day MA is at $32.30
- The daily OBV formed a negative divergence at the recent highs (line c) and is still negative. The weekly OBV (not shown) confirmed the recent highs
- There is short-term resistance now at $35-$35.43 with stronger resistance above $36
What It Means: The decline over the past two weeks has clearly caused some technical and psychological damage to the markets. In many ways, the outlook for stocks is worse than it was in the summer of 2010 even though that decline was much sharper than the current one.
Sentiment readings still indicate that we are closer to a market low, and the positive readings of the A/D lines for both the NYSE and S&P 500 do not indicate that a major top is in place.
With so much focus on the March lows, I would expect them to be broken, and a decline in SPY to the $122-$123.60 level or 1220-1230 in the S&P 500 would not be surprising.
If XLE breaks stronger support, it could be new selling in the energy complex that drives the markets lower over the near term. Of course, later in the summer, lower crude oil prices will be a positive for the economy and for consumers.
How to Profit: I still think that the current decline will be an opportunity to buy stocks in the select sectors and industry groups that are showing the best relative performance.
These are the three sector ETFs I like, along with my latest open recommendations:
Select Sector SPDR - Health Care (XLV): Go 50% long at $34.40 and 50% long at $33.74 with a stop at $31.68 (risk of approx. 7.4%).
Select Sector SPDR - Consumer Staples (XLP): Buyers should be 50% long at $31.12, and may now go 50% long at $30.74 or better with a stop at $29.44 (risk of approx. 4.8%).
Select Sector SPDR - Utilities (XLU): Buyers should be 50% long at $33.16 and 50% long at $32.86 with a stop at $31.48 (risk of approx. 4.6%).


