History proves that the current meltdown is not a first, and those who avoid panic selling now should be rewarded with better exit points as recovery unfolds in the months ahead.
The relentless nature of the stock market decline over the past 12 days has been astounding, and the Dow Industrials has dropped 15%. Given the expansion of the derivatives market, the volatility is clearly higher now than it has been in past market declines.
A great example of this is seen in the action since Monday’s close in the S&P futures. The September S&P futures closed Monday at 1111.25 with a low for the day of 1109.50. Overnight, the futures dropped as low as 1077—more than 40 points below Monday’s close—and then reached a high of 1148, which was 37 points above Monday’s close.
Monday’s drop was the largest since December 1, 2008, when the Dow dropped 680 points, although in 2008, the market regained those losses just five days later. Clearly, this decline must be looked at in a different light.
The selling in some of the individual stocks has been even more severe, as Bank of America (BAC) was down 20% on Monday alone. The relative performance, or RS analysis, for the big banks has been negative for most of the year, and in early July (see “3 Big Banks That Aren’t Cheap Enough”), this analysis suggested they were still vulnerable.
So is this market decline the worst, and if not, can past market declines help prepare us for what may happen next? Let’s take a look at some interesting historical examples.
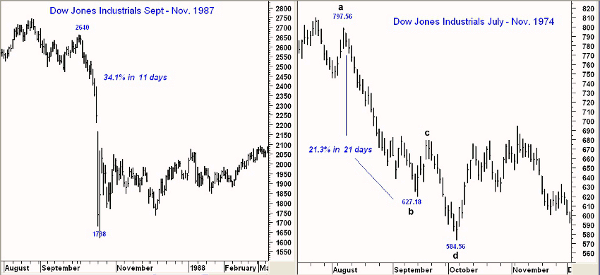
Chart Analysis: The market decline that is most familiar to many of today’s market veterans is the plunge in 1987, when from the close on October 2 at 2640, the Dow closed 11 days later at 1738.
- This was a 34.1% drop in just 11 days, and on day 12, the Dow made a lower low but eventually closed up for the day
- This was followed by sideways trading and one more drop back towards the lows in December before stocks turned higher
- It was not until July 1989 that the Dow was able to surpass the pre-crash levels
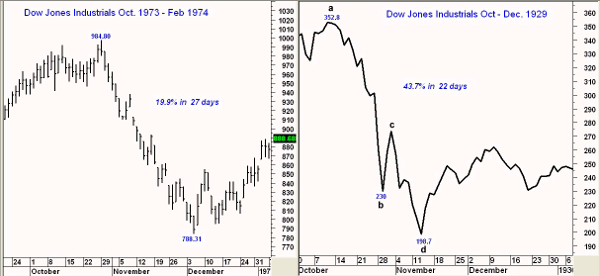
The bear market of the 1970’s is less familiar to most, but it was pretty wicked and lasted for quite some time. It has two distinct legs, and the worst occurred in the latter part of 1974.
- The Dow peaked in June 1974 at 865 and by early August (point a), it had formed a series of lower highs
- From the close in August until the interim low in September, point b, the Dow was down 21.3% in 21 days. A week before this low, the Dow had a two-day, 5% bounce
- The Dow made further new lows at 584.56 (point d) in early October, which was a decline of 26.7% from the August highs
- The Dow rallied over 20% in the next month and then dropped below the September lows in December 1974, completing the bear market bottom
NEXT: 1973-1974 Bear Market; How to Handle the Current Market
|pagebreak|The 1973-1974 bear market lasted long enough to convince many to stay out of stocks for the next decade. The Dow peaked in early 1973 at 1067 and then dropped to a low of 845 in August.
- By early November, the Dow had rebounded 16% to close at a high of 984.80
- Over the next 27 days, the Dow dropped 19.9% to a low close of 788.31
- This low was followed by an eight-month trading range, and the Dow did manage to rebound over 15% from the lows before breaking to new lows in July 1974
Over the past 100 years, there have been a number of large percentage declines in the Dow Industrials, but none compare to the decline in 1929. On October 10, 1929, the Dow had a closing high of 352.80 (point a).
- Just 14 days later, on October 29, the Dow had dropped 34.8% (point b)
- In the following two days, the Dow rallied over 18% (point c) before the decline resumed
- The low on November 13 at 198.7 (point d) represented a drop of 43.7% in just 22 trading days
- The last leg of the decline was the most severe, and from the rebound high (point c) to the November low (point d), the Dow dropped 27.3% in just eight trading days
What It Means: These four examples illustrate that our current market decline is not an isolated event, but it also does not help us to determine how much further the decline can go. Before the opening on Tuesday, the Dow futures were up 140 points, but a higher close is what is needed to stem the slide.
Market history does tell us that a 15%-20% market rally is likely over the next few months. If you measure this from Monday’s close at 10,809, this could take the Dow back above 12,000.
How to Profit: Though it is very difficult to avoid when the market is plunging, panic selling is generally a poor idea. That is why I advocate placing sell stops on all long positions, because you can then avoid second guessing the original decision to buy.
If you are currently long stocks that have not been stopped out, you should get an opportunity to lighten those positions or adjust your portfolio at higher levels.


