
Many expect commodities like gold and silver to rise on continued stock weakness, but chart and volume patterns indicate that the metals may be due for a decline of their own.
Since the July 7 closing high in the S&P 500 at 1353, weakness in the stock market has correlated to strength in gold prices. The December Comex gold futures contract is up 18.4% during this period, while the S&P is down 14.1%.
Tuesday’s early weakness in the stock market was met with some surprising strength into the close as the September E-mini S&P 500 futures closed 34 points above the day’s lows. This surely gave the bulls some hope and made those who were short quite nervous.
Overnight in Europe, stocks were lower on concerns over the health of European banks, but so far, the futures are holding up well. These banks have looked weak for some time, and the RS analysis on several suggested in August that the global banks could fall further.
So if stocks drop back to the August lows, does it mean that gold is going to rise another $50 or $100? It is always possible, but for the first time since early in the year, the volume analysis is showing signs of weakness, which points to a correction, not a further rally.
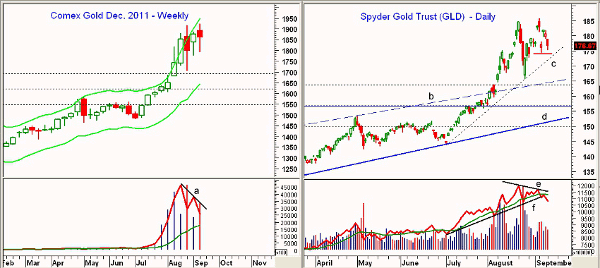
Click to Enlarge
Chart Analysis: This weekly chart of the December Comex gold futures is updated through September 9 and does not reflect the $40+ drop on Monday. For the past five weeks, gold has traded above the weekly Starc+ band.
- The futures made a new weekly closing high the week ending September 3 and closed $17 lower last week
- The weekly on-balance volume (OBV) has formed a short-term negative divergence, line a, and has dropped below its prior lows
- There is chart support now at $1778-$1793 with the 38.2% support at $1693
- The more important 50% support is at $1622
- There is initial resistance now in the $1840-$1860 area
The daily chart of the SPDR Gold Trust (GLD) shows a very broad trading range over the past three weeks. The trading range has resistance at $185.85 with support at $165.88.
- On a short-term basis there are stops likely at $174.45 (red line) with the daily uptrend, line c, in the $171.40
- The 38.2% support and the upper trading channel (lines b) are in the $163.40 area
- The more important 50% support stands at $156.70 with the uptrend (line d) in the $152 area
- The daily OBV has also formed a short-term negative divergence, line e, over the past three weeks. The break of the uptrend (line f) is a further sign of weakness
- Resistance now stands at $180-$182 with stronger resistance at $184-$185.65
NEXT: Latest Chart Action for Silver; How to Profit
|pagebreak|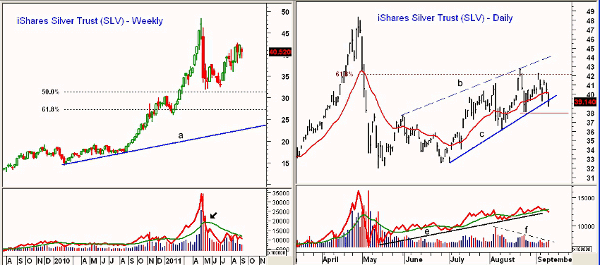
Click to Enlarge
The weekly chart of the iShares Silver Trust (SLV) shows the sharp rally from the late-June lows at $32.53.
- The rally has not been supported by the volume, as the weekly OBV has been unable to move back above its weighted moving average
- There is weekly chart support at $36.55 with the 50% retracement support at $31.33. The more important 61.8% support level is at $27.25
The daily chart of SLV shows that the flag formation, lines c and d, was completed on Monday with the close below support, line c. Stops are likely in the $38 area (red line).
- The daily chart has further support in the $34-$35.50 area
- The OBV has dropped below its weighted moving average and is testing its uptrend, line e. The volume has declined since early August, line f
- SLV closed above the 61.8% resistance on August 22 but was unable to go much higher. The resistance at $42.30-$42.80 now seems to be quite formidable
What It Means: Over four weeks ago, I noted that gold was in a high-risk buying zone based on the Starc band analysis. Since gold and the SPDR Gold Trust (GLD) are still trading near the weekly Starc+ bands, the risk is still high on the long side.
This increases the chances of a 5%-10% decline over the next few weeks. The monthly volume analysis is still positive for the long-term trend.
Silver is a different story, however, and I would not be surprised if a large percentage of those long SLV are hoping for a replay of the parabolic rally earlier this year. It does look more vulnerable, as SLV may be in weak hands.
How to Profit: My advice for GLD has not changed in the past month. Those with nice profits in their GLD positions should consider hedging by selling calls against the long position for a drop to $155-$165 area.
If you are a recent buyer, I would recommend lightening up on strength and using tight stops, because one of these days, we could see heavy selling in Asia that would lead to a sharply lower opening.
For SLV, aggressive traders could sell at $41.54 with a stop at $43.23 (risk of approx. 4%). Cancel the order if $38 is hit first.


