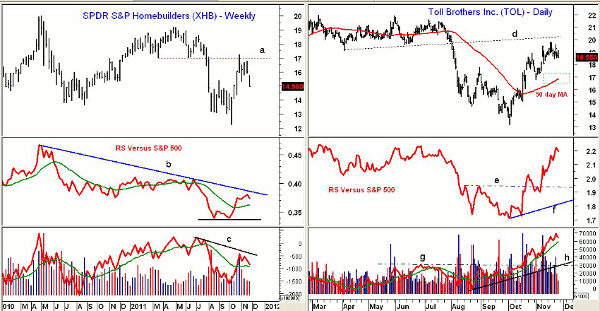
The technical action in many of the prominent homebuilding stocks shows the formation of important bottom patterns, thus setting up potential opportunities in these stocks and a primary sector ETF.
This week brings lots of data on the housing market with new home sales due out Monday, followed by the S&P Case-Shiller housing price index on Tuesday. On Wednesday, pending homes sales for October are due, followed by the latest report on construction spending.
Last week, the National Association of Realtors reported that while sales rose in October, prices are still declining. Another positive for the housing market is that rents in many areas have risen to the point where owning a home is now cheaper than renting.
A recent Wall Street Journal article reported that owning was cheaper than renting in markets that included Detroit, Orlando, Las Vegas, Chicago, and Miami. Even if this week’s data is disappointing, the technical action in the homebuilding stocks over the past few months suggests that they are likely forming significant bottom formations.
Chart Analysis: The chart of the SPDR S&P Homebuilders ETF (XHB) shows that its rally appears to have stalled in the $17 area, line a, which corresponds to the 61.8% Fibonacci retracement resistance.
- There is further resistance on the long-term charts in the $18.40-$20 area. XHB traded above $46 in 2006
- Weekly relative performance, or RS analysis, formed a positive divergence at the lows and then moved above its weighted moving average (WMA)
- The RS line has turned lower but is still well above its rising WMA. It has long-term resistance at line b
- Weekly on-balance volume (OBV) is holding above its flat weighted moving average but needs to move through resistance at line c to complete its bottom formation
- The daily OBV is negative and shows a pattern consistent with a correction
- The 50% retracement support is at $14.70 with the 61.8% level at $14.12
Toll Brothers (TOL) is a $3.01 billion builder of homes in mainly luxury communities and recently acquired CamWest Development, LLC, which was one of the largest privately owned builders in the Pacific Northwest.
- TOL has rallied back to strong chart resistance in the $19.80-$20.20 area after hitting a low of $13.16 on October 4
- The weekly RS formed a bullish divergence at the lows, line f, that was confirmed by the move through resistance at line e
- The daily OBV acted much stronger than prices, forming much higher lows in October (line h) before moving sharply through resistance at line g
- The weekly OBV (not shown) was also able to move through year-long resistance
- There is first support at $17.80-$18.20 with the 38.2%-50% support zone (see box) at $16.50-$17.25
- This also corresponds to the rising 50-day moving average. The 61.8% support level is at $15.75
NEXT: Bottom Formations in Two Other Top Homebuilders
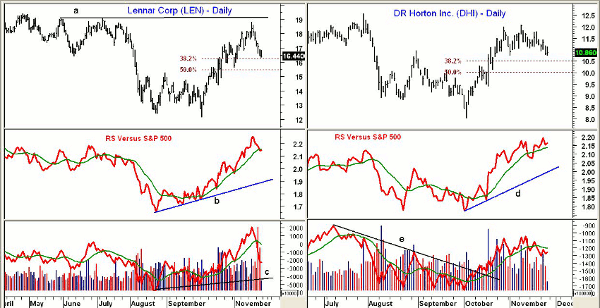
|pagebreak|Lennar Corp. (LEN) is a $3.07 billion residential construction company that hit a high of $18.82 on November 16. The stock rose more than 55% from the October 4 lows of $12.14. Over the past six days, LEN has dropped over 12% from the recent highs.
- The 38.2% support is just below Friday’s low at $16.20 with the 50% support at $15.45
- There is more important chart and retracement support in the $14.70-$14.36 area
- Daily technical studies like the RS and OBV formed bullish divergences at the October lows, consistent with a double-bottom formation
- The RS line formed much higher lows, line b, in October, and has moved above the summer highs. It is acting stronger than prices, indicating that prices will also move above the summer’s highs at $19.10 (line a)
- The volume surged when LEN rallied from the October lows and the OBV formed a positive divergence, line c
- Heavy selling in the past few days has dropped the OBV below its weighted moving average, but the weekly OBV (not shown) looks very strong
DR Horton Inc. (DHI) is a $4.3 billion residential construction company whose shares have gained almost 50% from the October lows at $8.04. The rally appears to have stalled below the July highs at $12.55. In 2005, DHI traded as high as $42.82.
- The daily RS line made new highs last week and completed its bottom formation in October. Good RS support at line d
- The daily OBV moved through its downtrend, line e, just six days after the lows
- The weekly OBV (not shown) has dropped below its weighted moving average and does not look as strong as the OBV on Lennar (LEN)
- The 38.2% support is now at $10.50 with the 50% support now at $10
- There is key support in the $9.40-$9.55 area
What It Means: The daily technical action of these homebuilding stocks at the October lows was impressive and the intermediate-term action suggests that a major bottom may be forming. The extent of the current correction and the strength of the next rally should give us confirmation.
Look to buy either XHB or the individual homebuilding stocks on a test of stronger support where the risk can be well controlled.
How to Profit: Of the three stocks, Toll Brothers (TOL) and Lennar Corp. (LEN) look the best technically. For TOL, go 50% long at $17.44 and 50% long at $15.62 with a stop at $14.92 (risk of approx. 9.7%).
For LEN, go 50% long at $15.86 and 50% long at $15.08 with a stop at $14.18 (risk of approx. 8.3%).
For DR Horton Inc. (DHI), go 50% long at $10.46 and 50% long at $9.96 with a stop at $9.28 (risk of approx. 9.1%).
For the SPDR S&P Homebuilders ETF (XHB), go 50% long at $14.74 and 50% long at $14.44 with a stop at $14.16 (risk of approx. 2.9%).


