
Recent stock buyers are hoping that Fed Chairman will hint at a new round of easing today in order to improve the faltering economy, but MoneyShow’s Tom Aspray takes a look at the market's internal health to determine whether they might be disappointed.
The widely anticipated speech by Ben Bernanke will likely be occurring as this article is being published. Though more and more investors seem to have moved to the sidelines, some apparently bought stocks over the past few weeks in anticipation of a new round of easing.
Taking a position in expectation of a change in policy is never a good idea. Over the years, I have found that the technical studies will warn of a market turn well ahead of any news.
For example, several months before the Iraq invasion of Kuwait in 1990, crude oil and gold had already completed their bottom formations. This gave the technical investor a good opportunity to get long before prices surged.
The technical outlook for the stock market has not changed much since I left for vacation several weeks ago. The Spyder Trust (SPY) is now just about where it was on August 10, when I advised that investors should not be “greedy or complacent,” as the technical picture did not favor aggressive action.
So has the technical outlook changed enough to take a more aggressive position in the stock market? Or does it suggest that stock investors will be disappointed as they head into the Labor Day weekend? Let’s look at the evidence.
Click
to Enlarge
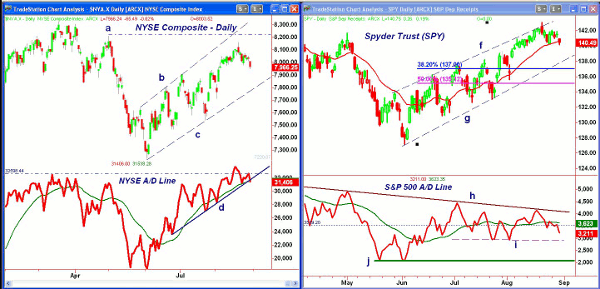
Chart Analysis: The NYSE Composite peaked on August 21 at 8,160, and as of Thursday’s close is down 2.4% from the highs. There is stronger resistance from May at 8,211.
- The daily chart shows a well-established trading channel (lines and b).
- There is next support at 7,870 to 7,730 and the uptrend (line b).
- The new highs in the NYSE Composite were confirmed by the A/D line, as it moved well above the early March highs (dashed line). This is positive for the intermediate-term trend.
- The NYSE A/D line closed below its uptrend (line d) and its WMA on Thursday. This has weakened the short-term outlook, and increases the odds of a deeper correction.
The Spyder Trust (SPY) also made its high of $143.09 on August 21, and is now testing support in the $139.80 to $140.20 area.
- The close on Thursday was right on the 20-day EMA, with further support in the $139.40 area.
- The daily uptrend (line g) is now in the $137.60 area, with the 38.2% Fibonacci retracement support at $137.
- A daily close below this level will suggest a drop back to the 50% retracement support at $135.12.
- The S&P 500 A/D tested the long-term downtrend (line h) as prices were peaking, but the pattern of lower highs (negative divergences) is a sign of weakness.
- The A/D line has been below its WMA since then and has important support at line i, which corresponds to the late July-August lows.
- There is major support at the June lows, as the bullish divergence identified the market lows.
- The S&P 500 A/D line needs to move above the August highs to turn positive.
NEXT: A Closer Look at Tech and Small Caps
|pagebreak|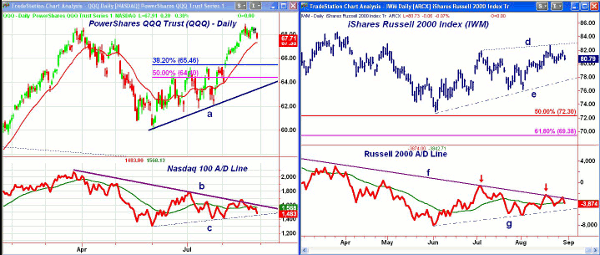
Click
to Enlarge
PowerShares QQQ Trust (QQQ) barely exceeded the April highs at $68.55 just over a week ago, but it has now dropped back to initial support.
- A close below the 20-day WMA at $67.35 will weaken the short-term outlook.
- There is further support at $66.28 to $66.50, with the 38.2% Fibonacci retracement support at $65.46. The more important 50% retracement support stands at $64.40, with the daily uptrend (line a) at $63.75.
- The Nasdaq-100 A/D line failed to confirm the new price highs. While it briefly broke the downtrend from the March highs (line b), it was unable to move above the early July highs.
- The A/D line is very close to breaking its uptrend (line c), and a drop below the late July lows would confirm the most recent bearish divergence.
- The A/D line now needs a decisive move above the August highs to turn positive.
The iShares Russell 2000 Index (IWM) made marginal new highs in August (line d), but the rally from the June lows appears to be just a pause in the overall downtrend.
- From the charts it is clear that the rally in IWM lacks the impulsive nature of the action in SPY or QQQ. A break of support (line e) will suggest a drop at least to the $72.30 area.
- The more important 50% retracement support is at $69.38.
- The Russell 2000 A/D line has been even weaker than prices, as it has stayed below the negative divergence resistance (line f) that goes back to early in the year.
- The pattern of lower highs in the A/D line since July (see arrows) is a further sign of weakness.
- A break of its uptrend (line g) and the early August lows will signal a sharper decline.
What it Means: Though the intermediate-term outlook for the stock market remains positive, the short-term outlook has weakened further over the past few weeks. The small-cap sector looks especially vulnerable.
I would expect an eventual correction to the 38.2% support. A move to new rally highs on any Bernanke comments are likely to be accompanied by further divergences.
A defensive strategy is still recommended. While I would not be doing aggressive new buying now, there are a number of issues that will look attractive on a pullback to support.
How to Profit: None of the inverse ETFs that I follow are currently giving any strong new buy signals, but if that changes, I will send out updates via Twitter. In particular, I am watching the ProShares Short Russell 2000 (RWM).
Portfolio Update: Investors should be 50% long the Spyder Trust (SPY) from $132.85, as 50% was sold at $139.62. Use a stop at $138.90 and sell half of the remaining position at $142.48 or better.
NEXT: See the Updated Charts in Play Portfolio
|pagebreak|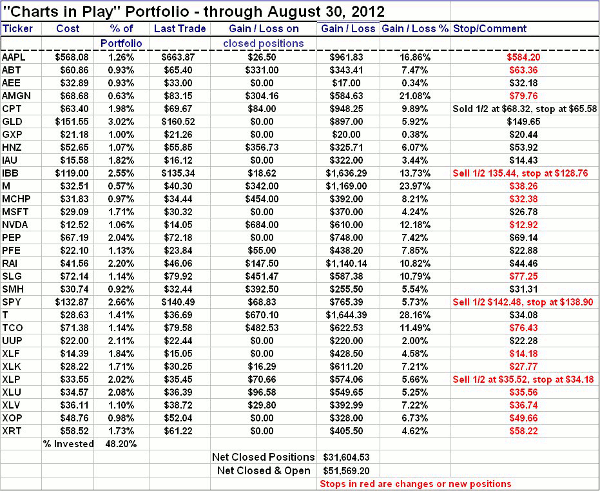
Click
to Enlarge


