
The positive start to earnings season and sharp improvement of China's December trade surplus has buoyed the market as MoneyShow's Tom Aspray examines how a surging stock market could affect bonds.
Wednesday's gain in the stock market indicates that the market's correction may now be over as the advancing stocks led the decliners by a 2-1 margin. Therefore the Advance/Decline line is leading prices higher, which is a positive sign.
A strong close in the S&P 500 above 1466 should signal a rally to the 1495-1505 area. This would certainly squeeze many on the short side, but I don't think it will convince the long-term pessimists. They are likely to find more signs of economic weakness or political Armageddon to add to their "wall of worry."
If stocks do accelerate to the upside, a more interesting question is what will happen to bonds? While stocks surged to start the New Year the bond market was hit hard as the yield on the 10-year Treasury Note rose from 1.756% to over 1.965% in just three days.
This certainly got the attention of some bond holders but most seem to be quite complacent. In 2012, there was an inflow of $56 billion to bond funds, so the lack of any great concern by bond holders is not surprising. So does the technical evidence suggest any change in the long-term bond bull market, let's take a look.
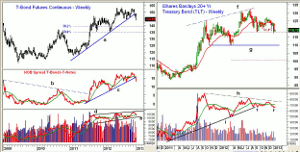
Click to Enlarge
Chart Analysis: The weekly chart of the T-Bond futures shows that the uptrend from the 2011 lows, line a, has been broken over the past three weeks.
- The next major support is in the 139 1/2 area, which is the 38.2%
Fibonacci retracement support of the rally from the 2011 lows.
- A weekly close below the October 2011 low at 137 12/32nds and the 50%
retracement support will be a stronger sign that a major top may have formed.
- The NOB spread (long bonds - short T-notes) does appear to have topped out
as it made its high in November as stocks were bottoming.
- In April 2012, the NOB spread formed diverged from stocks as they
were peaking and this warned of the correction that lasted until early
June.
- The break of the uptrend in the spread (line c) may indeed be significant
but a failing rally back to the declining 21 WMA could complete the topping
process.
- The weekly OBV made higher highs in November, line d, which is not
consistent with a major top.
- A break of OBV support at line e is needed to weaken the
outlook.
The rebound in the iShares Barclays 20+ Year Treasury Bond Fund (TLT) failed at $127.19 in mid-November as it has dropped below the September lows at $123.92.
- The recent low at $117.32 violated the 61.8% Fibonacci
retracement support at $118.35, which was calculated from the May lows.
- There is further support at $115 with major, line g, in the 110 area.
- The weekly on-balance
volume (OBV) broke its long-term uptrend, line j, in September.
- During the November rally, the OBV was just able to move slightly above
its WMA.
- The longer-term negative divergence in the OBV (line h) is consistent with
a major top.
- The OBV has now dropped below the lows from last spring (see arrows).
- TLT is now below the quarterly
pivot at $120.98, which now becomes the first strong level of
resistance.
NEXT PAGE: Have Bonds Topped Out?
|pagebreak|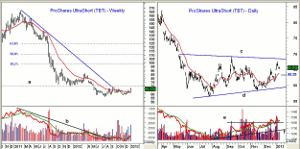
Click to Enlarge
The ProShares Ultrashort 20+ Treasury (TBT) is a double inverse ETF of TLT. It has an expense ratio of 0.92% compared to 0.15% for TLT.
- The weekly chart shows a potential bottom formation as it closed last week
well above its 20 week EMA.
- The weekly downtrend, line a, was broken in September with next major
resistance in the $70 area.
- The quarterly R1 resistance for TBT is at $74.34.
- TBT had a high in February 2011 of $166.16 and the 38.2% Fibonacci
retracement resistance is at $98.
- Volume was low into the November lows but has increased over the past few
weeks.
- The weekly OBV broke its downtrend in September, line b, confirming the
price action.
- The OBV is now back above its WMA.
- The 20-week EMA at $62.84 now represents first weekly support.
The daily chart of the ProShares Ultrashort 20+ Treasury (TBT) shows what could be either a bottom or a continuation formation (lines c and d).
- TBT had a high last Friday at $67.48 but has since pulled back with gap
support now at $63.67 to $64.68.
- The 20-day EMA is at $63.80 and TBT is well above the quarterly pivot at
$63.25, which represents further support.
- A drop below the last swing low at $61.23 would set the stage for a test
of the $59 level, line d.
- The daily OBV
appears to have completed its bottom formation as it has moved through
resistance at line e.
- The OBV shows a solid uptrend from the August lows, line f.
What it Means: Stock market bulls, me included, have been looking for a move out of bonds and into stocks, which could fuel an upward explosion in stock prices. The failure of bonds to top out has also kept many reluctant bulls on the sidelines.
Clearly it is way too early for me to conclude that bonds have topped out, but the action over the next four to six weeks will provide more evidence.
Technically, TBT looks attractive for purchase at slightly lower levels and it could also be used as a light hedge for those with large bond portfolios.
How to Profit: For ProShares Ultrashort 20+ Treasury (TBT), go 50% long at $64.48 and 50% long at $63.88, with a stop at $60.63 (risk of approx. 5.5%).


