Being a consistently profitable trader requires constant focus on several key elements of success, including locking in profits on open winning positions on the first signs of weakness, which MoneyShow's Tom Aspray does in the Charts in Play portfolio.
For the fifteenth straight Tuesday in a row, the Dow Industrials closed higher but it did give up half of its gains by the close. In fact, the Dow has been up every Tuesday this year except for January 8.
The market internals were positive Tuesday but did deteriorate as the day progressed. The S&P futures are down seven points lower ahead of the opening, and there is little in the way of economic data out Wednesday. There is a full slate Thursday including GDP, jobless claims, and pending home sales.
The daily technical studies are showing a further loss of upside momentum and a close in the Spyder Trust (SPY) below $163.90 would weaken the short-term outlook. Therefore, there are three stocks in the Charts in Play portfolio where partial profits should be taken now and their charts will illustrate the reason for my caution.
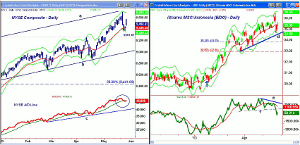
Chart Analysis: The daily chart of the NYSE shows that it tested the daily starc- bands last Thursday and Friday before Tuesday's strong opening.
- The close was below the middle of the day's range with first support now at 9426 and the flattening 20-day EMA.
- There is more important support in the 9372-9376 area.
- A break of this level will signal a drop to the April highs at 9261.
- The initial daily uptrend is at 9000 with further support from earlier in the year at 8700-8800.
- The NYSE Advance/Decline dropped below its WMA last week and on Tuesday just rallied back to its WMA (see circle), which appears to be flattening out.
- A day of negative A/D numbers will further weaken the short-term outlook and suggest a drop back to initial support at line c.
- Initial resistance now at 9570 and the daily starc+ band was tested a week ago.
iShares MSCI Indonesia (EIDO) bottomed out early in the year and longs were established on January 24 (see arrow) and it broke through major resistance in early February.
- The daily starc+ band was tested last week as was the weekly starc- band.
- The daily uptrend is at $34.60 with the 38.2% Fibonacci retracement support at $33.79.
- The 50% retracement support is at $32.96, which also corresponds to the late March lows.
- The daily OBV did not confirm last week's highs as it formed a negative divergence, line e.
- This divergence was confirmed when the OBV broke support at line f.
- There is initial resistance now at $35.70-$36.20 with monthly pivot resistance at $37.04.
NEXT PAGE: 2 Stocks to Sell
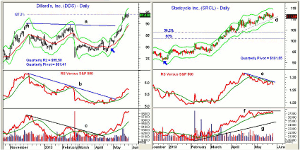
|pagebreak|Dillard's, Inc. (DDS), was bought in early May (see arrow), per the article from late April. DDS completed its trading range when the resistance at line a was overcome.
- DDS reached the 127.2% Fibonacci retracement target from the trading range last week.
- The quarterly R2 resistance is at $95.50 and the daily starc+ band was also touched last week.
- The weekly starc+ band was exceeded in the past two weeks.
- The daily relative performance broke its downtrend in May and is in a solid uptrend.
- The RS line is well above its rising WMA.
- The daily OBV also looks strong but there is a large gap between the OBV and its WMA.
- There is first good support in the $89 area with the 38.2% retracement support at $87.48.
- The 50% retracement support is at $85.10.
Stericycle Inc. (SRCL) was bought just before Christmas and reached a high on May 17 of $113.11. SRCL had a gradual decline last week before Tuesday's rebound.
- There is first support at $110.38 with further at $106-$107.15.
- The 38.2% Fibonacci retracement support is at $103.84.
- The daily relative performance peaked in April and has since formed lower highs, line e.
- The RS line shows a pattern of lower highs and is below its WMA.
- The weekly RS line did not confirm the recent highs.
- The daily OBV has formed a negative divergence since the latter part of April, line f.
- The OBV is still above its flattening WMA with major support at the uptrend, line g.
- The weekly OBV has confirmed the recent price highs.
What it Means: There are still no confirmed signs that a top is in place, but a lower close today with negative market internals should provide further evidence that we are in the top-building process. Therefore, it is time to take some nice profits on part of these three positions. I have included Dillard's, Inc. (DDS) even though it has not given any sell signals but is overextended. It is also a good time to update the strategy on the rest of the Charts in Play portfolio.
How to Profit: No new recommendation
Portfolio Update: Recommendations were also tweeted before the opening.
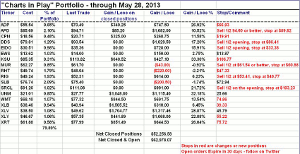
For iShares MSCI Indonesia (EIDO), should be long at $30.51 as we just missed our sell level at $36.86. Sell half on the opening and use a stop at $33.38 on the remaining position.
For Stericycle Inc. (SRCL), should be long at $91.26. Sell half on the opening and use a stop at $103.23 on the remaining positions.
For Dillard's, Inc. (DDS), should be long at $79.81. Sell half on the opening and use a stop at $86.41 on the remaining positions.
NEXT PAGE: The Charts in Play Portfolio
|pagebreak|


