
Rounded arc patterns don’t happen often, but when they do, they offer solid buying or selling opportunities, and here, Corey Rosenbloom of AfraidToTrade.com offers a recent example.
Netflix (NFLX) recently attracted trader and investor attention with the recent gap-up and reversal off its 2012 low, so let’s view a key Fibonacci pivot level and assess the rounded arc reversal pattern that brought the stock to its current point. As a bonus, let’s look at price levels that may be important in the near future.
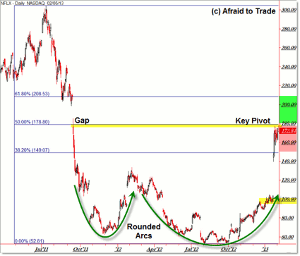
First, let’s start with the key price level at work in Netflix (NFLX) stock currently:
Click to Enlarge
After two “rounded arc” or rounded reversal patterns (the first pattern failed to result in a trend reversal in 2011 but the longer/larger 2012 pattern did precede the current reversal), Netflix broke to new recovery highs not seen since its collapse in September 2011.
In fact, NFLX has recovered roughly 50% of the loss from the $305 peak (July 13, 2011) to the (so far) final inflection low at $53 per share (August 3, 2012).
The current inflection pivot at $180 is where we’ll focus our attention now. Not only is it the 50% Fibonacci retracement at $178.80 (or “halfway recovery point”), but it’s also the opening price of the sharp downside gap (collapse) that occurred on September 15, 2011 (gap open: $176.73).
Short-term traders should focus on these key level for short-term game-planning tactics:
A breakthrough above the $180 confluence target suggests that NFLX could continue its sharp uptrend toward the “round number” $200 target then $205 to $210 price and Fibonacci confluence.
A short-term retracement/reversal here suggests that price will challenge the $160 level if not the $150 level for a potential downside objective.
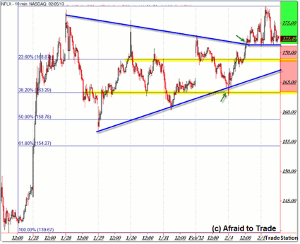
Let’s zoom in on the chart to see the intraday perspective and clearer short-term intraday/swing trading reference levels:
Click to Enlarge
I drew a short-term Fibonacci reference grid from the low of the gap-up on January 24, 2013, to the high today on February 5.
The immediate levels to watch (for possible targets IF price breaks under the current blue horizontal intraday support into $172) would be $168.90 then $163.30 if price breaks under the $169 level.
Note also the rising blue trendline that will soon intersect the $168.90 Fibonacci and price reference level.
Be sure to incorporate the short-term intraday charts with the higher frame daily chart levels ($178.80 and $176.63) mentioned above.
Remember, the goal is not to predict, but to react or adapt to real-time breaks of key levels.
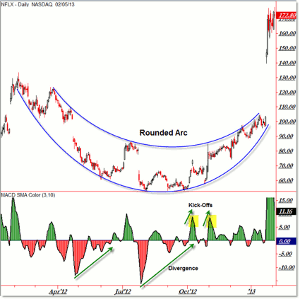
For a quick educational reference, let’s look at the broader “rounded arc” pattern that developed through 2012:
Click to Enlarge
I’ve written many times about “rounded arcs” or “rounded reversal” patterns and Netflix (NFLX) gives us another clean example of the concept as it developed the pattern through 2012.
Rounded reversals/arcs occur as a result of a gentle (as opposed to violent/spiky) transfer of supply to demand and the pattern shows up on the chart as a visual arc.
The momentum oscillator often shows lengthy positive divergences as price forms the ‘floor’ or lengthy bottom. Notice that Netflix made at least a triple-bottom pattern before reversing, underscoring the point that fighting a trend in motion can be very difficult.
After divergences form, it’s good to note strength in the momentum oscillator (or volume) in terms of spike-highs in the oscillator when price is NOT making corresponding new swing highs—we call these “kick-off” signals and they are often “signs of strength” for a potential trend reversal yet to come.
The short-term trend reversed when NFLX began making higher price highs and higher price lows and particularly with the confirmation signal on a break above the July 2012 swing high into the $90 per share region.
Trend reversals, in general, often take time to develop and it’s best to join with the winning side on confirmation or breakthrough signals as opposed to playing “bottom fisher” and hoping for an eventual reversal.
Note that a smaller similar pattern formed through April to June 2012 but failed quickly as price pushed to carve out its final floor (bottom) over the months of July through October.
To underscore the point—it takes time and effort (and a large-scale shift in the supply/demand relationship) to reverse a trend in motion as Netflix reminded us all through 2012.
By Corey Rosenbloom, CMT, Trader and Blogger, AfraidToTrade.com


