

Apple has recently formed a “death cross” on its daily chart and this could be bad news not only for the stock but for the entire US stock market, says John Nyaradi of Wall Street Sector Selector.
In the chart below, we can see how Apple (AAPL) recently formed the “death cross” in which the blue 50-day moving average crossed below the red 200 day moving average. This formation is widely viewed in technical analysis as a “sell” signal for a particular company’s stock.
Much has been written about this recent death cross formation with some analysts viewing it as a buying opportunity and others saying it bodes harder times ahead for the company stock.
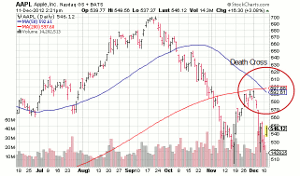
Chart courtesy of StockCharts.com
Click to Enlarge
CNBC reports that the death cross has been largely bad news for Apple, as there have been six death crosses since 2000. After those six events, the stock declined more than 5% within a month with an average loss of 10%. The largest drop came in September, 2008, with a 27% decline, and double digit declines were also recorded three other times.
While Apple investors should certainly pay attention to the “death cross,” this event also has potentially wide implications for the broader US market. Apple is the largest company in the world by market cap and makes up 15% of the Nasdaq Composite, more than Google and Microsoft combined. It also makes up 20% of PowerShares QQQ Trust (QQQ), the leading Nasdaq tech ETF and Apple is the largest holding, by far, in the portfolios of US hedge funds and largest mutual funds.
No other company has this kind of footprint in the US stock market and so it’s easy to see how it’s quite likely that, “as goes Apple, so goes the market.”
The long-term chart of Apple (AAPL) below shows us that Apple has made just three sustained breaks below its 200-day moving average and that the “death cross” has occurred on just three occasions, including the one last week, since the tranquil days of 2007.
In September, 2008, Apple broke its 200-day moving average and suffered a 50% decline by January, 2009.
More ominously, the S&P 500 (SPY) followed Apple’s descent, dropping 47% between September, 2008 and March, 2009.
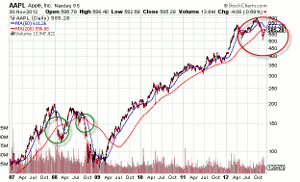
Chart courtesy of StockCharts.com
Click to Enlarge
Finally a look at Apple (AAPL) compared to the S&P 500 (SPY) in the chart below shows how tightly correlated the two markets are and how Apple tends to be a leading indicator for the S&P 500 (SPY).
At the right end of the chart, we see the recent pronounced divergence between the S&P 500 and Apple, and one way or other, this divergence will have to be resolved in coming days.
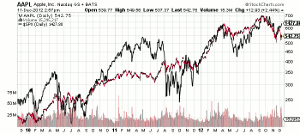
Chart courtesy of StockCharts.com
Click to Enlarge
Bottom line: Based on Apple’s dominance in the US stock market and its widely held status among major institutions, the death cross in Apple (AAPL) could easily be a “sell” signal for Apple and a the kiss of death for major US stock indexes, as well.
By John Nyaradi, Publisher, Wall Street Sector Selector


