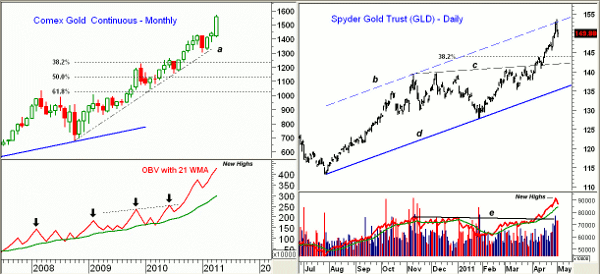
The high-flying metals have been hit hard in recent trading, but a look at the volume analysis and chart patterns shows that gold and silver have not yet completed major tops.
CME Group (CME) smacked the silver market hard over the past week with three margin hikes, and silver traders finally got the message. The widely followed iShares Silver Trust (SLV) closed Tuesday 15% below last week’s highs following the heavy selling.
Gold also reversed after making convincing new highs on Monday, but the selling in gold has been muted, as the Spyder Gold Trust (GLD) is just 2.4% below its highs. Though silver and gold are generally lumped together, their trading characteristics are often quite different.
Though my long-term outlook for gold and silver are similar, I expect the trading in gold to be different than that in silver over the next couple months. The bottom line is that my monthly volume analysis suggests that neither gold nor silver have completed major tops. Let’s look at the evidence.
Chart Analysis: The monthly chart of the Comex gold futures shows one of the strongest months since November 2009. Gold ended up peaking on December 1, 2009, and began a multi-month correction that turned many analysts bearish. Though parallels to the current action are interesting, the technical picture is not currently suggesting a repeat performance.
- The uptrend from the 2008 lows on the monthly chart is now at $1380 with the 38.2% support level at $1238
- The on-balance volume (OBV) accelerated to the upside in April and is well above its previous peaks. The arrows highlight the new highs in the monthly OBV, which I have discussed over the past few years
- The wide gap between the OBV and its weighted moving average (WMA) does favor some consolidation. The weekly OBV (not shown) also confirmed the recent highs and it is well above its rising weighted moving average.
The Spyder Gold Trust (GLD) hit the upper boundary of its trading channel on Monday (line b) before reversing to close lower. The next minor support comes in at $145.50-$147.50.
- The 38.2% retracement support calculated from the January 2011 lows is just below $144. A retest of the breakout level (line c) could take GLD to the $142 area
- The major uptrend on the daily chart, line d, is now at $136.50 with the major 38.2% support from the 2010 lows at $134
- The weekly and monthly OBVs (not shown) are positive and have confirmed the recent price highs. The daily OBV broke through resistance at line e in early April, preceding the strong gains. It has turned down and is still above its rising WMA
- There is initial resistance now at $151 and then at $153 with minor Fibonacci targets at $154.50
NEXT: Latest Analysis for Silver ETF SLV
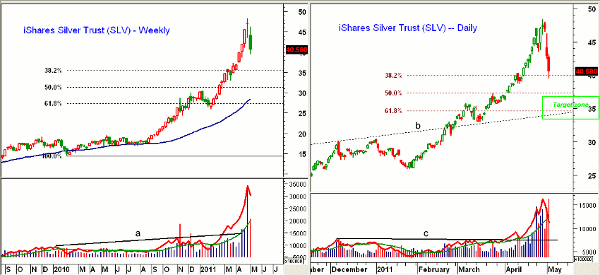
|pagebreak|To get a more accurate reading of any market, it is best to use two time frames in your analysis. The weekly chart of the iShares Silver Trust (SLV) is updated through Tuesday (May 3), and of course, it is the close this week that is more important.
- A close on the weekly chart below the lows of the last two weeks at $41.17 will suggest that the highs are in place…at least for a while
- The major 38.2% retracement support calculated from the February 2010 lows at $14.37 is at $35.50. The 50% support is at $31.30
- The rising 40-week moving average (MA), which corresponds to a 200-day MA, is at $28.50
- One way to identify an overextended market is to look at the gap between prices and a long-term moving average. In January, SLV was $9 above the 40-week MA, but this gap was cut in half by the end of the month
- Last Friday, SLV closed $19 above its 40-week MA
- The weekly OBV moved through year-long resistance (line a) towards the end of February. It did confirm the recent highs, as did the monthly OBV
On the daily chart for SLV, the drop below last week’s lows at $43.55 was a negative sign and clearly triggered some sell stops. The 38.2% support at $39.80, which is calculated from the early-2010 lows, was violated on Tuesday.
- The 50% support stands at $37.31 and the 61.8% support is at $34.60. This also corresponds to the former resistance (now support) at line b
- The heavy selling this week exceeded the level of buying last week, and the daily OBV has dropped below its weighted moving average. The OBV did make new highs last week with good support now at line c
- Initial resistance is now at $43.20-$44 with much stronger resistance at $46.20- $48.35
What It Means: The technical action in the gold futures and GLD do not yet indicate that an interim top has been completed. I would look for a short-term low in the next week, and then the strength of the next rally will tell us more. If we see a failing rally back towards Monday’s highs, it will weaken the short-term outlook.
As for silver, I would expect the recent highs to hold for some time, but I don’t think that a major top has been completed given the positive monthly and weekly technical action.
NEXT: How to Profit from Popular Metals ETFs; Portfolio Update
|pagebreak|How to Profit: On April 6, I recommended buying GLD at $140.92 with a stop at $136.92. The buying zone was hit on April 12 when GLD hit a low of $140.75. Raise the stop on that position from $139.33 to $143.42. On a move above $150.50, raise the stop to $146.22 and sell half the position at $152.40 or better.
I don’t think there is any hurry to get into SLV, as I would expect more volatile, wide-range trading that will frustrate those looking to establish a position.
A correction could last from three to eight weeks. On the above daily chart, I have highlighted a target zone and would go 50% long at $35.86 and 50% long at $34.64 with a stop at $30.84 (risk of approx. 12.5%). This is higher risk than I prefer, but if SLV does bottom—say, at $35—the projected upside targets are in the $51-$52 area.
I was concerned last November that many investors who were buying the metals ETFs did not fully appreciate the volatility of the metals, so I wrote “Are You Ready for Gold's Volatility?” In that article, I evaluated five of the major gold rallies since 2001 and closely examined the corrections that followed each of the rallies. Readers may find that analysis helpful now also.
Portfolio Update: Also on April 6, I recommended positions in gold miners, as I expected them to catch up with gold prices. Here is an update on those positions.
Longs in Market Vectors Gold Miners ETF (GDX) from $60.74-$61.53 were stopped out at $57.91 for a 5.9% loss.
The 50% long in Yamana Gold (AUY) from $12.93 and 50% long at $12.67 were stopped out at $11.93 for a loss of 6.7%.
The 50% long in Agnico-Eagle Mines (AEM) from $66.64 and 50% long at $66.24 were stopped out in the middle of April at $62.89 for a loss of 5.3%.


