It looks like this sector will lead the next serious rally, which creates a number of opportunities in sector-leading stocks and the primary tech ETF.
Stocks have retreated sharply from last week’s highs, as further concerns over the Euro debt crisis and the bank downgrades have caused many to question whether stocks have really bottomed.
The bearish sentiment is not as high as it was in early June, but many investors are understandably nervous with the upcoming Supreme Court ruling on Obamacare out Thursday, and with earnings season just around the corner.
The technical evidence in early June suggested that the stock market had formed a short-term low. Further improvement by June 8 indicated that a buying opportunity could be just around the corner. The major averages have now pulled back to more important support, and have reached levels where I would expect the market to find good support.
The relative performance, or RS analysis of the technology sector indicates that it should be a market-leading sector on the next rally. Some of the recommended buy levels for the “Tech Titans" have been hit, but the current pullback has created additional opportunities.
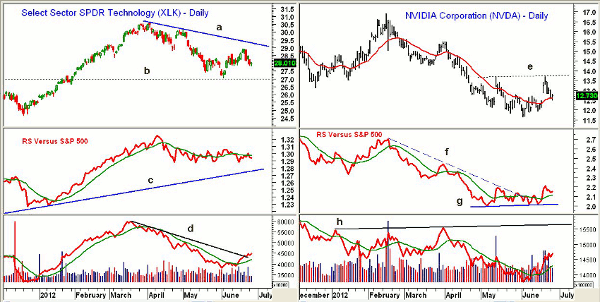
Chart Analysis: The Select Sector SPDR Technology (XLK) tested the stronger resistance just below the $29 level last week, and has now corrected back to first good support in the $27.80 area.
- The long-term support from 2011 in the $26.88 area (line b) was tested in May, with the 50% Fibonacci retracement support level at $26.62
- The daily RS analysis is slightly below its weighted moving average (WMA), but still well above its long-term uptrend (line c)
- The daily on-balance volume (OBV) has broken its downtrend (line d), and is well above its rising WMA
- The weekly OBV is holding above its WMA
- The daily downtrend is in the $29.26 area, with weekly resistance at $30.22
NVIDIA Corporation (NVDA) is a $7.8 billion provider of graphic semiconductor chips used in smartphones and computers. It peaked at $16.38 in February after rallying from the October low of $11.81.
- NVDA is now testing its rising 20-day EMA, with further support in the $11.90 to $12.20 area
- The RS analysis now appears to be bottoming, as the downtrend (line f) has been broken and it shows a potential base formation (line g)
- A move in the RS line above the recent high will start a new uptrend
- The OBV is now rising and is well above its rising WMA. It has major resistance at line h
- There is short-term resistance at $13.80 (line e), with more important levels at $15.50
- NVDA traded as high as $26.17 in early 2011, so the major 38.2% Fibonacci retracement resistance is at $17.12
NEXT: Tom’s Verdict on 2 More Mega-Cap Techs
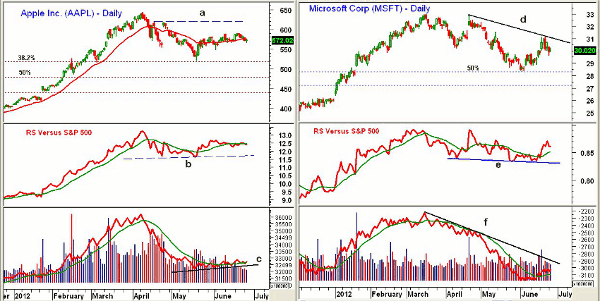
|pagebreak|Apple (AAPL) has been trading in a narrow range over the past two weeks. It turned lower after failing to surpass the resistance in the $590 area.
- AAPL is now below its flat 20-day EMA, with short-term support now at $548.50
- The daily chart does not yet show a typical corrective pattern, and it needs a move above the resistance in the $620 area to confirm that the correction is really over
- The RS line is flat, but did confirm the highs in early April
- The daily OBV is in a shallow uptrend (line c)
- The weekly OBV and RS line are both above their WMA
- On a break below $548, we could see a drop to the 38.2% support at $517
Microsoft (MSFT) was one of my favorite buy candidates from last fall based on its RS analysis. Long positions in MSFT from last year at $25.78 were closed out this spring at an average price of $30.05, as the correction was deeper than I expected.
- In late May, MSFT dropped down to test the major 50% retracement support at $28.32
- The recent rally has stalled at first resistance in the $31 area, with more important levels just above $32
- The RS analysis has formed slightly lower lows (line e), but does not show a clear new downtrend. It is above its rising WMA
- The weekly RS line (not shown) is in a clear uptrend
- The daily OBV is above its WMA, but below long-term resistance (line f)
- There is minor support now in the $29.30 to $29.50 area
What it Means: Though the technical indicators are still indicating that a short-term bottom is in place, the major Advance/Decline resistance needs to be overcome to signal that a major new uptrend is underway.
The longer-term technical action of the technology sector ETFs, as well as many of the technology stocks, suggests they will be the leaders of the next major market rally. Therefore, the sector is still one of my favorite areas for new buying, as I noted last week, and NVDA looks particularly attractive at current levels.
How to Profit: For NVIDIA (NVDA), go 50% long at $12.64 and 50% long at $12.36, with a stop at $11.67 (risk of approx. 6.6%).
Investors should be 50% long the Select Sector SPDR Technology (XLK). Add another 50% at $27.62 or better, with a stop at $26.48.
Aggressive investors are 50% long Apple (AAPL) at $566.80. Add another 50% at $556.60, with a stop at $545.65.
Investors should be 50% long Intel (INTC) at $25.88, and I would add 50% long at $25.44, with a stop at $23.94.
For Microsoft (MSFT), investors should be 50% long at $29.20 and 50% long at $28.84, with a stop at $27.68.
For Automatic Data Processing (ADP), investors should be 50% long at $53.88. Add another 50% at $53.32, with a stop at $50.38.
For Microchip Tech (MCHP), investors should be 50% long at $32.08. Add another 50% at $31.44, with a stop at $29.82.


