
This leading financial magazine makes a bullish fundamental case for many of the energy stocks, so MoneyShow's technical analyst Tom Aspray looks at the charts to determine if now really is a good time to buy.
This week's Barron's cover story is titled "How To Play Energy." The story examines how the energy sector has been lagging the S&P 500, and why many analysts consider it to be attractive from a fundamental perspective.
Many of these stocks offer attractive dividends, and by some analysts' estimates are trading at "near liquidation value." Of course, even the best-valued companies can languish for some time before the market perceives their value and starts to bid their stock price higher.
Let's take a technical look at several of the large energy companies that were part of the Barron's article.
Click
to Enlarge
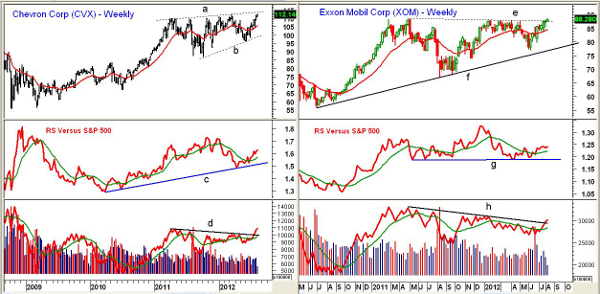
Chart Analysis: Chevron (CVX) is a $221 billion oil giant that currently yields 3.2%. They have raised their dividend twice in the past 12 months. Barron's credits them for their 25-year history of annual dividend increases.
- The weekly chart shows a broad, upward-sloping triangle formation (lines a and b) that goes back to early 2011.
- The stock has had a nice rally from the June lows at $96.02, as it is up over 13%.
- If CVX breaks out to the upside, there are upside targets from the flag formation in the $130 to $135 area.
- The weekly relative performance has moved well above its WMA, but is still below the highs from late last year. The longer term uptrend in the RS (line c) is a positive sign.
- The weekly on-balance volume (OBV) pattern is positive, as it broke through resistance (line d) two weeks ago.
- The daily OBV (not shown) is in a strong uptrend.
- There is initial support now at $108.80 to $110, with the rising 20-week EMA at $105.80
Exxon Mobil (XOM) is an industry leader, and as Barron's notes, it has a "higher valuation than its other 'supermajors'" at 11 times its estimated 2012 profit. It currently yields 2.6%, but there are hopes of a dividend increase in the next year.
- The weekly chart shows that XOM is now trading above the upper boundaries of its two-year trading range (lines e and f).
- A convincing breakout above this resistance has initial targets in the $100 area, with the $105 to $108 area after that.
- The relative performance is above its slightly rising WMA, but not yet in a strong uptrend like it was in 2010.
- The weekly OBV has just broken its downtrend (line h), but is still below the late 2011 and early 2012 highs.
- The daily OBV (not shown) is positive, but lagging the price action.
- There is first good support in the $85.80 to $87 area, with more important levels now around $84.
NEXT: Turnaround Ahead for Beaten-Down Oil Stocks?
|pagebreak|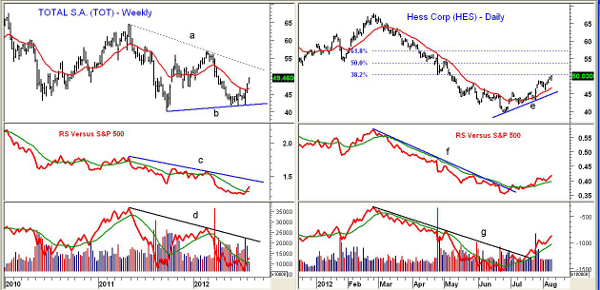
Click to Enlarge
Total (TOT) is a $111.5 billion French integrated oil and gas company that also has a large chemical division. It currently yields 4.9%. The stock has had a rough year, as it had a low of $41.83 in early June, which was not far above last year's low at $40. It has a current book value of $39.64.
- TOT has rallied 12% in the past three weeks, but is still well below the major downtrend (line a) in the $53 area.
- A weekly close above the prior high at $57.06 would complete a bottom. In 2008, TOT had a high of $91.34.
- The weekly RS line is back above its WMA, but still well below its downtrend (line c).
- The weekly OBV is still acting weak, as it is just barely above its WMA and well below the long-term downtrend (line c).
- There is first good support at $45.50 to $46.80 area, which corresponds to the rising 20-week EMA.
- There is much stronger support in the $43 to $44 area.
Hess (HES) is a $17.1 billion oil and gas refining company that has fallen out of favor with investors, as it is still over 26% below the February high of $67.86.
- The daily chart shows a nice uptrend (line e) from the lows, as tests of the rising 20-day EMA have been successful.
- The 38.2% Fibonacci retracement resistance has been reached with the 50% resistance at $53.70. The more important 61.8% retracement resistance is at $57.20.
- The daily relative performance broke its downtrend (line f) in early July.
- The weekly RS analysis (not shown) is rising, but still below its WMA
- The daily OBV did not form any positive divergences at the lows, but moved through its downtrend (line g) on July 17.
- There is first support now at $46, with much stronger levels in the $42.50 to $43.50 area.
What it Means: The relative performance in the energy sector has clearly improved, but a major low has not been confirmed yet. In the middle of July, there were early signs that crude oil and two of the energy ETFs were bottoming.
The energy ETFs and many of the oil stocks have had a nice run over the past three weeks and are now slightly overbought. Since the stock market still looks vulnerable to a correction and I would not be chasing the oil stocks at current levels.
Therefore, new purchases in the energy sector only look favorable on a pullback towards the recent lows where the risk on new longs can be well controlled. Of these four stocks, Chevron (CVX) and Total (TOT) look the most attractive for new purchases. The recommended buy zones may not be reached until later in the month.
As I have mentioned several times before, I find Barron's to be a valuable resource. Subscribers should read the entire article, as there are 21 stocks reviewed in their article.
How to Profit: For Chevron (CVX), go 50% long at $108.94 and 50% long at $106.72, with a stop at $101.84 (risk of approx. 5.5%).
For Total (TOT) go 50% long at $45.18 and 50% long at $44.58, with a stop at $41.62 (risk of approx. 7.2%).
Portfolio Update: For SPDR S&P Oil & Gas Exploration ETF (XOP), investors should be 50% long from $48.66 with a stop now at $47.38.


