With the market notching record highs, it is not surprising that a number of stocks are overbought says MoneyShow’s Tom Aspray, but his monthly scan also identifies those with the best long-term potential, as well as those that are most vulnerable.
It was quite a quarter for the stock market as the Dow Industrials had its best gain in 15 years. The S&P 500 and the Spyder Trust (SPY) finally closed at new all-time highs, which was a good sign for stock market bulls that were concerned about this non-confirmation.
The April-June period has been a tough time for stocks over the past three years as I reviewed last Friday, but the technical analysis of the market internals show no signs yet of a top. Overnight data on Chinese manufacturing and tensions in Korea pressured Japan’s market, which was down over 2%, but the S&P futures are only just a bit lower.
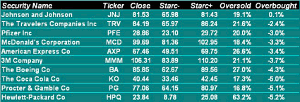
In this month’s starc band analysis of the stocks in the Dow Industrials, I picked two stocks that looked the most promising on a pullback and two that look the most vulnerable. This analysis identifies the stocks that are closest to their starc+ bands (overbought) and those that are nearest their starc- bands (oversold).
Since this became a regular monthly feature, it has helped identify some very good trades as the analysis of the monthly charts can often help better identify the major trend and important levels of support. After first looking at the monthly charts, I also review the weekly and daily technical outlook for each stock.
At the top of this month’s overbought list is Johnsons and Johnson (JNJ), which closed March 0.1% above its April monthly starc+ band. It is a stock I have liked since last December when I recommended buying it at $69.04 but it only dropped as low as $69.18. As I note below, while there are some long-term positives for this stock, it is a high-risk buy at current levels.
Two of the Dow’s top ten do look the most vulnerable during a market correction and those who own these stocks may want to take action.
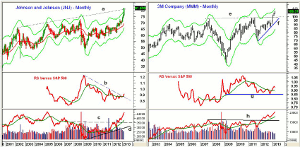
Chart Analysis: Johnson and Johnson (JNJ) reached the resistance last month that connects the 2002 and 2005 highs, line a.
- The March close was well above the last month’s starc+ band at $79.03.
- The relative performance has broken its downtrend, line b, but is just barely above its WMA.
- The RS line is still lagging the price action as it is below its 2011 highs.
- The OBV is looking much stronger as the monthly moved above several-year resistance (line c) late last year.
- The weekly and daily OBV (not shown) also made new highs so the OBV multiple time frame analysis is bullish.
- There is initial support at $79.62, which is April’s monthly pivot.
- Additional support at $77.60 with first monthly support now at $74.80=$75.73.
3M Company (MMM) moved to new all-time highs at the end of January as it closed above resistance, line e, at $77.95.
- This breakout has initial upside targets in the $125-$130 area.
- The relative performance tested long-term support, line g, last October and has since moved above its WMA.
- The RS line could still pull back to its WMA as the weekly (not shown) has turned down.
- The long-term pattern in the OBV looks much more bullish as it overcame long-term resistance, line h, in February 2012.
- There is first support now at $103.60-$104 and then at $101.50.
- There is monthly support now in the $97 area.
NEXT PAGE: Vulnerable Overbought Dow Stocks
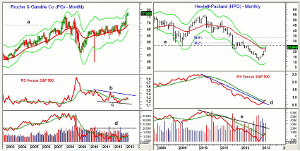
|pagebreak|Procter & Gamble Co. (PG) rose very sharply in January but traded in tight ranges over the past two months and closed March 5.1% below its April starc+ band.
- The late 2007 all-time high at $75.18 has been exceeded.
- The relative performance is barely above its declining WMA and is well below its downtrend, line b.
- The RS line has also made lower lows, which is a sign of weakness.
- The monthly OBV is also lagging the price action even though it is above its WMA.
- The OBV is well below the three-year resistance at line d.
- There is initial support now at $75, which if broken could signal a drop back to the more important support, line a, in the $68 area, which also corresponds to its 20-week EMA.
Hewlett-Packard (HPQ) hit a low of $11.35 last November and closed March at $23.84.
- There is next resistance that goes back to the 2009 low at $25.39 with the starc+ band at $25.08.
- The 38.2% Fibonacci resistance that goes back to the April 2010 high is at $28.
- The 50% retracement resistance is at $33.18.
- The relative performance has broken its long-term downtrend, line d, and just closed above its declining WMA.
- It does not yet indicate a completed bottom formation.
- The OBV has also moved above its WMA, but is still well above its downtrend, line e.
- HPQ has minor support in the $22 area with monthly pivot support at $21.
- The 38.2% retracement support calculated from last week’s high at $23.94 is at $19.09.
What it Means: If the market does undergo a meaningful correction in April, the most overbought Dow stocks especially Procter & Gamble Co. (PG) and Hewlett-Packard (HPQ) look the most vulnerable. Holders may want to hedge through covered calls.
I will also be watching Hewlett-Packard (HPQ) as a sharp correction could complete a long-term bottom formation.
On a decent pullback, I like 3M Company (MMM) the best followed by Johnson and Johnson (JNJ), which has been in the doldrums for many years.


