With multiple technical indicators and a well-known seasonal pattern all pointing lower for silver, traders will want to look for an official sell signal and be ready to capitalize on a potential down move.
February brings about several events. First we have Valentine’s Day; Lent begins with Ash Wednesday; and of course, most traders look forward to Presidents Day as we observe a three-day holiday (and the start of the Traders Expo in New York).
The truth of the matter is for die hard trading junkies, we can still trade currencies and stock indexes as the CME GLOBEX is open from Sunday night through Monday morning. Apart from that, we have several seasonal trade situations that occur this month.
The S&P 500 has shown a strong tendency to decline right before the Presidents Day holiday (February 20), an event that can last into early March. In addition, crude oil prices make a strong seasonal bottom. In the agricultural sector, live cattle prices tend to see follow-through strength from January’s gains, and soybeans begin a bullish advance that can last into late May or even through early June.
As for the precious metals, gold tends to peak out, as can silver from mid month. In fact, according to our work in the Commodity Traders Almanac, silver prices in the last 39 years have declined in this time period 29 times for a success record of 74.4%.
One of the worst-performing years was last year, when silver made a historic counter-seasonal rally. The price of silver moved from January’s close of $28.02, and by the end of April, silver traded to a high of $49.82, basis the continuous front-month contract.
Since that high was made, silver has been in a downtrend, reaching a low of $26.145 in December 2011. It could be a very interesting situation, as we are now in a presidential election year, both in the US as well as other foreign countries, specifically Russia and France.
In addition, we have a different global economic picture. The European Central Bank provided their own “quantitative easing” to help shore up European banks to avert a further debt crisis. Moreover, both China and India are expected to maintain a solid, albeit lower GDP growth rate in 2012.
These factors could quash investors’ fears as well as decrease demand from a slowing of economic expansion from these two developing nations. Combined, these factors could reduce demand from a flight to safety perspective for silver this year
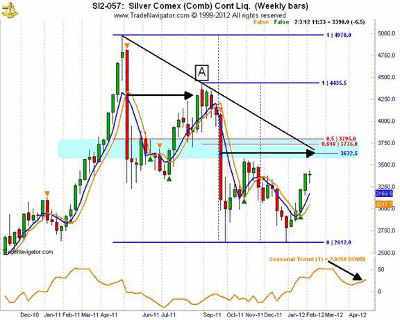
Technically speaking, I am viewing a potential target of resistance in silver between $37.00 and $38.00 based on a variety of technical tools.
First, using simple Fibonacci retracement levels from two different time and price locations, we have what is called a confluence of resistance between the $37.35 and $37.95 areas. From the high in April to the low in December 2011, you will see we have an exact 50% correction level at $37.95. From the peak high in August to the December low, we have a .618% retracement value at $37.35.
See related: Fibonacci Analysis: Master the Basics
Secondly, if you draw a simple trend line from the peaks of those two highs and extend out to the right, it will intersect by mid-month (red circle) at the $37.00 level.
Thirdly, one of my favorite bearish candle patterns is a red opening Marabozu formation, which was created the week of September 23. Generally speaking, markets will come back to test the midpoint of the real body (opening/closing range), and this can act as a resistance level.
Notice the similar reaction from the red opening Marabozu formation from May 2011? The high made in August was just at the midpoint of that candle marked “point “A” on the chart in Figure 1.
NEXT: Person's Pivot Indicator Defines Important Price Target
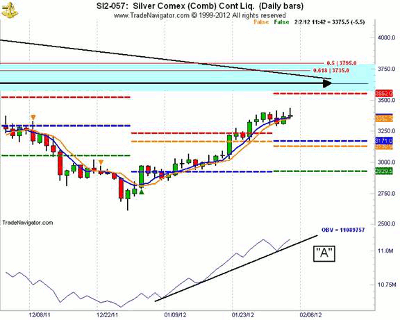
|pagebreak|One last coincident resistance target level is $35.52; this was created by the use of the monthly Person’s Pivot indicator. Using a daily chart in figure 2, we see the current trend is up, and silver is in an official buy signal, as established from the green triangle that was created on January 3.
In the lower quadrant, I am using Joe Granville’s on-balance volume (OBV) indicator to better reflect the health of this current uptrend. Once (and if) prices do trade near the $37.00 level, I will be looking for a formal sell signal and confirmation from a potential divergence in volume to confirm the uptrend has lost momentum before establishing any short position.
The technical tools I have used to identify the potential resistance level for silver are non-correlated. We have Fibonacci, trend line analysis, candlestick analysis, and pivot points. All we need to do is wait for a sell signal to confirm a reversal to complete a time and price objective.
On the other hand, do be aware if silver penetrates this level of resistance drawn from the various tools illustrated in this article, as prices could extend significantly higher.
In Summary
Technical analysis is a fascinating field, and I have discovered that the more tools that point towards a specific resistance or support level, the better the odds that level can hold.
If all the Fibonacci analysts, trend line users, and pivot point users see a resistance or support point, it attracts that many different users to reach the same conclusion. But be aware if a level fails, that means there are that many more traders who are wrong and will likely get out of the position, and that is what can propel prices sharply higher, as I just mentioned.
I use seasonal analysis to alert me to time a potential trend change, but when combined with the use of specific technical tools like I have used in this example, we can nearly pinpoint the price level from which a price turn may occur.
It will be interesting to see how this trade scenario will work out, and we will follow up in a future article, or you can visit my Web site for more information.
Remember the old adage, “The trend is your friend until it ends.” The tools discussed in this article may give you an edge in determining just when a trend will in fact end.
Editors Note: For the week ending February 3, the iShares Silver Trust (SLV) formed a "doji." As I have written about in the past, a weekly close below this week’s low at $32.02 would give a low close doji sell signal.
By John L. Person of PersonsPlanet.com


