If the market keeps rising, it could push nervous money managers back into stocks…but you don’t need to wait for the big money to make sensible buys into these specific assets, writes MoneyShow.com senior editor Tom Aspray.
In early September, I suggested that you “Fasten Your Seatbelts." That should have been my advice for the entire fourth quarter.
It was another incredible week for the stock market, as the grinding decline during Thanksgiving week discouraged many investors (but apparently not shoppers). From November 21 through November 25, the S&P 500 lost almost 57 points…only to gain 85 points this week.
Wednesday’s gain, the largest in the Dow since March 2009, caused a surge into all risk assets. The coordinated action of the central banks that caused this bump may influence the market for the rest of December.
Though volume was heavy Wednesday, many skeptics attributed the gains to short covering. This may be the case, but how the market acts after the next pullback will tell us more.
The S&P 500 is still over 3% below the October highs, but the sharp improvement in the market internals (see below) suggests that stocks will surpass the October highs before the end of the year.
The news-driven market has left many individual investors—as well as some professionals—quite frustrated. Underinvested portfolio managers could fuel the next move to the upside, as many are uncharacteristically light on stocks. The pressure may be ongoing into the end of the year.
The next big hurdle for the Euro crisis is the December 9 meeting of Eurozone leaders, but comments last Friday by various leaders suggest that the crisis is not over.
Early last week, there was further talk that the euro would break up. The costs of this would be astounding, and the imbalances between the weak and strong currencies would foster a new crisis. I still do not think it will happen.
The positive economic news, including the better-than-expected jobs report, should help reassure investors. The cut in bank reserve requirements by the People’s Bank of China may have an important impact on the Asian markets as we head into 2012.
In order to take advantage of the sharp updrafts and minimize the damage from the downdrafts, you have had to act ahead of the news. This requires a disciplined approach and an overall strategy.
After Wednesday’s sharply higher open, the risk was too high on new long positions, as wide stops needed to be used. Selected buying near support in those stocks or sectors that are outperforming the S&P 500 is still favored.
I expect that many of the perennial bears were looking for stocks to plunge on the opening on Friday, in reaction to what they thought would be a worse-than-expected monthly jobs report. Stocks did give up there nice early gains by the close on Friday, and a further pullback in the market is likely this week.
There is a fairly light economic calendar this week, with factory orders and the ISM Non-Manufacturing Index on Monday, followed by jobless claims on Thursday. The latest numbers on international trade are released Friday, along with consumer sentiment.
NEXT: What to Watch
|pagebreak|WHAT TO WATCH
The major averages reversed to close lower on Friday, but that was consistent with the short-term overbought status. A 2% pullback in the major averages would not be surprising, but the other possibility is that we will just trade sideways to a bit lower before the rally resumes. This scenario would give the underinvested fund managers less of a chance to get in.
The sentiment has become less bullish after the sharp sell-off during the week of Thanksgiving. The number of bulls in the AAII survey declined from 41.9% two weeks ago to 33%, while the Investors Intelligence Survey of newsletter writers saw a slight decline in bulls to 44.2%. These are pretty neutral numbers, and it will take some time for them to reach bullish extremes.
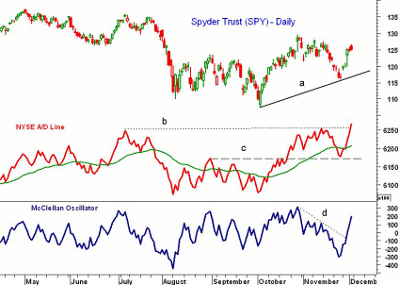
The NYSE A/D line moved above both the July and the late October highs (line b) on Friday. Typically when the A/D line is much stronger than prices, prices will eventually catch up. The A/D line did drop to test good support from early September (line c) on Black Friday.
The NYSE A/D line is acting stronger than the A/D line for the Dow Industrials or the S&P 500, but it is the broadest measure of the market internals. The McClellan oscillator broke its downtrend (line d) last Tuesday (November 29), and is moderately overbought above +200.
S&P 500
The Spyder Trust (SPY) violated the 50% retracement support at $118.43, but held above the 61.8% Fibonacci retracement support at $115.83.
Last Thursday’s close above $124.50 indicated that the correction is over. The next resistance is at $127.40 to $128 with the 78.6% Fibonacci retracement resistance next at $131. This level is the last hope for the bears, but many likely have stops above $128.
There is initial support for SPY at $123.60 to $124, with much stronger between $121.35 and $122.50.
|pagebreak|Dow Industrials
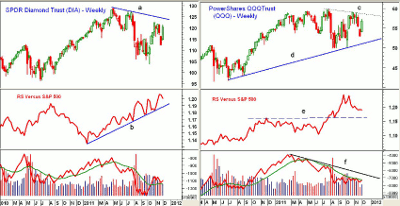
The Spyder Diamonds Trust (DIA) also violated the 50% retracement support at $113.21, as it bottomed at $112.14. This was above the 61.8% support at $111.
DIA is already close to the next strong resistance at $121 to $121.60, with the October highs next at $122.58. The downtrend on the weekly chart (line a) is now at $124.20.
The weekly relative performance, or RS analysis, has been in a strong uptrend all year. Many have favored the large-cap, high-dividend Dow stocks.
The weekly on-balance volume (OBV) is back above its WMA, and will turn up this week. Another higher close this week will turn it quite positive.
There is first support for DIA at $118, with a large gap between $116.18 and $118.41.
Nasdaq-100
The PowerShares QQQ Trust (QQQ) was the strongest sector last Thursday. This caught the market by surprise, since the technology sector had been lagging badly.
The weekly chart looks much better after last week, but there is still very strong resistance in the $57.50 to $58.50 area, which coincides with the downtrend (line c).
The weekly RS line surged sharply during the summer, when tech did outperform for a while, but I had expected it to last longer. It is now closer to support at line e. The daily RS is still in a solid downtrend, and shows no signs yet that its decline is over.
The weekly OBV is close to moving above its WMA, which is flattening out. A move above its WMA and the downtrend (line f) would be positive.
Initial support for QQQ is at 54.80 to $55.50 with more important levels at $53 to $53.50. The long-term weekly uptrend (line d) is now at $51.15.
NEXT: Small Caps, Sector Focus, and Tom’s Outlook
|pagebreak|Russell 2000
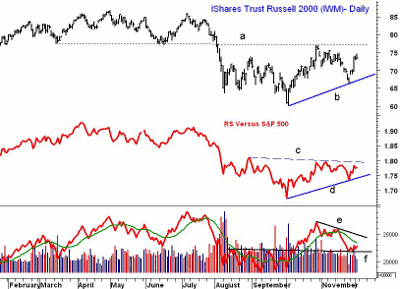
The iShares Russell 2000 Index Fund (IWM) was hit hard in November, as it gapped through support in the $70 to $70.40 area and finally bottomed at $66.62.
IWM had an impressive rally last week, especially on Wednesday, and is back to resistance in the $75 area.
There is still the major 61.8% resistance in the $77 area (line a). A strong close above this level will be bullish for the small caps. This could trigger a rally to the $84 area.
The daily RS line shows a nice uptrend from the September lows (line d), but needs to move through resistance (line c) to signal that the small caps are starting to outperform.
This would be consistent with the January Effect, which I wrote about last week.
If you followed my recommendations from last week, the suggested buying zones were hit and the positions are acting well. Raise your stops to 1.5% below the entry level to minimize the risk. Once the small caps start to lead, I will have more on small-cap stocks.
The daily OBV is still below its downtrend (line e) and its WMA, but is holding support at line f.
Sector Focus
The standout sector last week was the Select Sector SPDR Consumer Staples (XLP), as it was the only major sector to exceed its weekly resistance. As I mentioned earlier, a strong weekly close above $31.70 should signal upward acceleration.
The Dow Jones Transportation Average is also acting pretty well, and could move above the October highs this week, which would be a positive for the overall market.
I will have a more complete review of the major sectors later this coming week in my Charts in Play feature.
NEXT: Commodities, Bonds, and Tom’s Outlook
|pagebreak|Oil
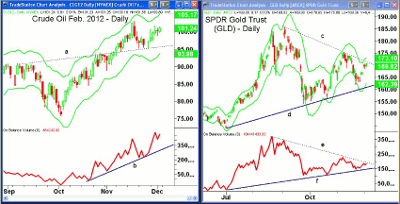
Crude oil has been quite strong since completing its double-bottom formation in October, as the recent pullback held the support in the $95 area (basis the February contract). The upside target from the formation is in the $106 to $107 area.
The recent high was at $103.28, with the upper daily Starc band just above $105.
The daily OBV did form a positive divergence at the lows, and has been in a solid uptrend (line b), as it held support on the correction. It is acting stronger than prices, which is also positive.
As I discussed in great detail in my recent Trading Lesson, “The Four Key Seasonal Trends for 2012,” crude oil has a pretty reliable seasonal pattern that typically bottoms in February.
Interest Rates
Yields on the ten-year Treasury Note held in a narrow range last week, which surprised many participants and has worried some of the stock-market bulls. A new uptrend in yields is needed to encourage bondholders to switch to stocks.
Precious Metals
The technical outlook for the SPDR Gold Trust (GLD) has improved, and suggests that a deeper correction is less likely. GLD closed just below the downtrend (line c), with the daily Starc+ band at $173.
There is initial support now at $168.50 to $167, which could be tested this week. The lower boundary of the flag formation (line d) is below $162.
The daily OBV also shows a triangle formation (lines e and f). It would be normal for the OBV to break out ahead of prices, so I will be watching it closely this week.
The initial upside target from the flag formation is in the $194 area.
The chart of the iShares Silver Trust (SLV) is less conclusive, as it needs a strong close above $34.50 to turn positive. A close below $29.80 would be a short-term negative.
The Week Ahead
My positive outlook since the start of the fall was severely tested during Thanksgiving week, but last week’s action does support the bullish case. There are likely to be further downdrafts as the market moves higher, but it would take a decisive close below the November 25 lows to turn the outlook negative.
If stocks continue to move higher over the next week or two, the professional money managers are likely to become more nervous and buy more heavily. The neutral sentiment and positive market internals continues to favor buying stocks at support, but as always, use stops.
We could get a good risk-reward entry in gold over the next week or so, for what could be a strong first quarter of 2012.
- Don’t miss Tom’s latest Trading Lesson: The Four Key Seasonal Trends for 2012


