That rally, when it starts, could see us through the rest of the year, but some sectors are better positioned than others. MoneyShow senior editor Tom Aspray explains the sectors and plays he’s most excited about as the second half unfolds.
What started as a fairly dismal week in the stock market finished on a positive note, as financial stocks finished the week very strong. This was helped by the 17% increase in earnings from Wells Fargo (WFC), which sent its stock surging over 3%.
Stocks also responded well to the long-awaited conference call with JPMorgan Chase (JPM). Despite announcing that the estimated loss on their hedge was now $5.8 billion, they seemed to be successful in convincing the markets that this was an isolated event. Their stock was up close to 6% on Friday.
So far, 47 of the S&P 500 companies have warned of lower profits, which is making many quite skeptical of the stock market’s upside potential. The slowing demand from Europe is the primary concern, along with fear that China’s economy will suffer a hard landing.
The latest news on the Chinese economy shows a GDP growth rate of 7.6%, but the drop below 8% was not taken badly by the markets. They responded positively to this report, as it was in line with analysts’ estimates, and there was other data out of China suggesting that their economy may be bottoming.
Friday’s rally came at just the right time. Many of the major averages and technical studies had dropped to important levels of support on Thursday’s close. Of course, now the market needs to prove itself on the upside by moving to new highs for the month.
The outlook for earnings is quite bleak, but this could already be factored into stock prices. It is possible that if earnings just meet the lowered expectations, it will trigger new buying. For instance, Wells Fargo just beat the consensus earnings per share estimate by a penny, but the stock price rose sharply.
As I discussed in May, the fourth year in a president’s term is typically a positive one for stocks. I don’t think this can be ignored.
As Jim Stack points out in this recent interview: “There is only one presidential election year since 1940 that has seen a double-digit decline in the Dow, and that was 2008. Now on the flip side of the coin, if you look at how many presidential election years have seen double-digit gains since 1940, there have been seven of them. Those are the kind of odds that investors have to like this year.”
Of course, stocks typically start to move higher when the sentiment is quite negative (remember last fall?). Worries over the so-called “fiscal cliff” are keeping many out of stocks. The spending cuts and tax increases that could start next year are increasing the level of uncertainty, and may impact the GDP this year.
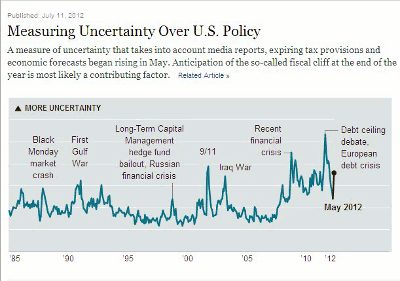
The New York Times ran an interesting chart of "Uncertainty Over U.S. Policy," which shows that it picked up in May. It is still well below the all-time high from last summer that was spurred by the debt-ceiling debate and the Euro debt crisis.
Those familiar with market history will note that several peaks in this index coincided with lows in the stock market. It should not be surprising that extreme levels of pessimism coincide with market lows.
Unlike last week, there is a very full calendar of economic data this week, so if stocks are able to close higher for the week, it would be quite significant.
On Monday, retail sales, business inventories, and the Empire State Manufacturing Survey will be released. This is important because the global deterioration in some of the manufacturing data has been a concern.
Tuesday brings the Consumer Price Index and industrial production, followed on Wednesday by housing starts. Then on Thursday, in addition to the weekly unemployment claims, we will see the new numbers on existing home sales, as well as Leading Indicators and the Philadelphia Fed Survey.
|pagebreak|WHAT TO WATCH
Many of the widely watched stock averages broke their uptrends from the June lows in early trading Thursday, but closed back above them. This gave encouragement to the bulls, and it was rewarded with sharp gains Friday that were enough to bring most of the averages back into positive territory for the week.
In last Thursday’s “Bear Flag or Bear Trap?" I discussed the two opposing views of the stock market’s rally from the June lows. The correction from the early July highs lasted a day longer than expected, and if stocks had closed Thursday on the lows, it would have shifted the evidence slightly to the bearish camp.
Though the public’s lack of interest or trust in the stock market seems to be high enough for a market bottom, the normal sentiment numbers are mixed. The individual investors according to AAII became more negative last week, with just over 30% are bullish. The newsletter writers, on the other hand, became more encouraged—44.7% are now bullish, up a couple of percent from the past week.
As I mentioned a few weeks ago, option traders were bearish enough at the June lows to signal an important low, according to option expert Larry McMillan. His long term put-call ratio gave a buy signal on June 18.
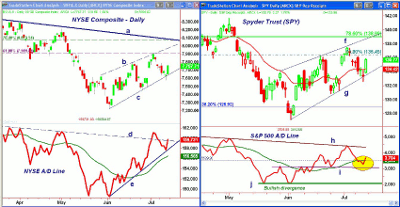
The daily chart of the NYSE Composite and the cumulative NYSE Advance/Decline line provided clear evidence of why Friday’s rally was important for the bullish case. The lower boundary of the flag formation (line c) was broken Thursday, but not on the close.
The rally failed in early July at 7,909, which is the 61.8% Fibonacci retracement resistance, so this is the next level that needs to be overcome. The more important 78.6% resistance and the downtrend (line a) are in the 8,073 area.
The NYSE A/D line did overcome important resistance (line d) before dropping back to test its uptrend (line e). The A/D line has turned up from this support in impressive fashion, and a move above the prior peak this week would be a sign of strength. Clearly, the support at last Thursday’s lows is now quite important.
S&P 500
The Spyder Trust (SPY) closed pretty much unchanged for the week, as it got as low as $132.60 last Thursday but did not close below its uptrend (line g). There is next resistance now at $136.30, with further levels in the $138 to $138.50 area.
SPY had already exceeded the 61.8% Fibonacci retracement resistance on the last rally, so the next key level to watch is the 78.6% resistance at $138.99.
The S&P 500 A/D line was much weaker on the correction, as it dropped below its WMA and came quite close to the late June lows (line i). Now that the A/D line is back above its WMA, it needs to overcome the major resistance (line h) to confirm a sustainable new uptrend.
SPY did not close below the 20-day EMA last week, and it now represents first support at $134.39. There is further support at $132.60, with key levels near $130.85.
Dow Industrials
The SPDR Diamonds Trust (DIA) closed below its 20-day EMA last Tuesday, hitting a low of $124.77, which was in the middle of the support zone identified last time. DIA did close the week slightly lower.
There is next resistance for DIA at $128.14, and then more important levels in the $129.40 to $130.50 area.
The Dow Industrials A/D line (not shown) closed below its WMA last Thursday, but was back above it by Friday’s close. On a further rally, the bearish divergence resistance that connects the April and May high needs to be overcome.
NEXT: Nasdaq, Sector Focus, and Tom’s Outlook
|pagebreak|Nasdaq-100
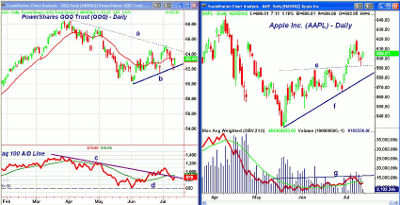
The PowerShares QQQ Trust (QQQ) reversed quite sharply after breaking its downtrend from the April highs in early July (line a). The strength of the current rally will be important, as so far earnings from the tech sector have been disappointing.
There is next resistance at $64.51, and then at $65.32, which is the 61.78% Fibonacci resistance level. The all important 78.6% resistance stands at $66.72.
The Nasdaq-100 A/D line also reversed sharply after breaking through its downtrend (line c) at the end of June. The A/D is still below its WMA, and if tech is going to be a market-leading sector, it needs to make new highs on the current rally.
There is support now at $61.86 and then $61.54.
The tech sector continues to be led higher by Apple (AAPL), which moved through resistance at $590 in early July and reached a high of $619.87. AAPL retested the breakout level last week, getting as low as $592.68 before closing the week near $605.
Volume has been low for the last six weeks, and the on-balance volume (OBV) is still below its resistance (line g). A move above this level is likely needed to signal a move to new highs.
Russell 2000
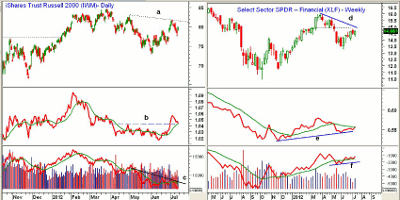
The iShares Russell 2000 Index Fund (IWM) dropped to a low of $77.59 last Thursday, almost filling the gap from June 29. Despite Friday’s rally, it did finish the week a bit lower. The next resistance stands at $81 to $81.50 and the downtrend (line a). There is major resistance waiting between $82 and $84.
The Russell 2000 A/D line (not shown) held above its WMA on the correction, which is a positive sign, though it is still below long-term resistance.
The relative performance, or RS analysis completed its bottom formation in June by moving through the resistance (line b). It is still holding above its WMA, and suggests the small caps are becoming a leading sector. The OBV is still weak, however, remaining below the downtrend (line c).
Sector Focus
The iShares Dow Jones Transportation Average Index Fund (IYT) rebounded from the support in the $90 area to close the week just a bit lower. It needs to close above $94.66 to signal an upside breakout.
The Select Sector SPDR Financials (XLF) was very strong Friday, thanks in part to Wells Fargo (WFC), and did close the week near its highs. The major weekly downtrend (line d) is now in the $15 area. The weekly RS line did close just barely above its WMA, and maintained its uptrend (line e). The weekly OBV is above its WMA, which is also a positive sign.
The Select Sector SPDR Health Care (XLV) and the Select Sector SPDR Consumer Staples (XLP) had strong weeks. XLP closed at new highs for the year. XLV still looks good, as the drug stocks are acting very well.
The Select Sector SPDR Technology (XLK), Select Sector SPDR Consumer Discretionary (XLY), Select Sector SPDR Energy (XLE), and Select Sector SPDR Materials (XLB) are all still well below the early July highs.
NEXT: Oil, Metals, and Tom’s Outlook
|pagebreak|Crude Oil
The August crude-oil contract closed the week up over $3 per barrel, as the inventory report was smaller than expected. A low is likely in place for crude oil, and it has been leading the stock market higher. It is still below the major 38.2% retracement resistance from the March high, which stands at $90.34.
The August contract has support now in the $83.60 to $82.10 area. I will be considering new positions in the energy sector this week.
Precious Metals
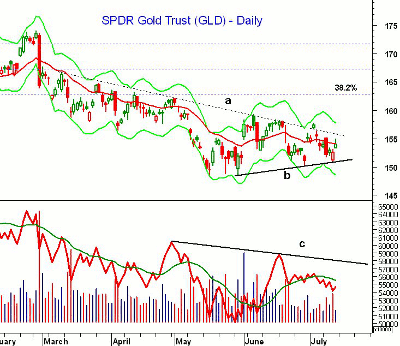
The SPDR Gold Trust (GLD) also hit a critical level Thursday, as support (line b) was tested. Friday’s gains did help the outlook, but it needs to close above $158 to stabilize the outlook.
The volume Friday was not impressive, and the OBV is still below its WMA. Resistance stands at line c. A decisive break below the late June low at $150.15 will suggest one more washout on the downside before gold bottoms. Stay tuned.
The Week Ahead
Well, the stock did turn higher by the end of the week, but there needs to be further strength to confirm the bullish case and suggest we have begun the election-year rally that could last until the end of the year.
We certainly did get a test of good support last week, which allows for good risk control for those who used it as a buying opportunity. If we get confirmation of a new intermediate-term uptrend, there will be plenty of buying opportunities in the coming weeks. The financial and energy sector are looking more interesting, especially the small caps.
I adjusted stops last week for the stocks in my “Charts in Play” portfolio, and if stocks do not impress me on the upside this week, I will likely become a bit more defensive.
- Don’t forget to read this week’s trading lesson, Bear Flag or Bear Trap?

