Double-bottom patterns on the charts for key metal producers like Rio Tinto (RIO) and Alcoa (AA) could bring about good entry points for patient investors in 2012.
China’s decision last week to lower bank reserves suggests that the emerging giant could cut rates in 2012. It is thought that such a rate cut would stop the slowdown in the Chinese economy and be positive for the other emerging market economies as well.
The aluminum market has been hit hard by the weakness in the global economy, and prices have declined while supply seems to be increasing. As a result, the decision by Rio Tinto (RIO) to invest $2.7 billion in order to complete an aluminum mine in British Columbia suggests the company is expecting aluminum prices to be firmer when the plant is completed in 2014.
If that outlook is correct, should we be looking to buy the stocks of the key aluminum companies now?
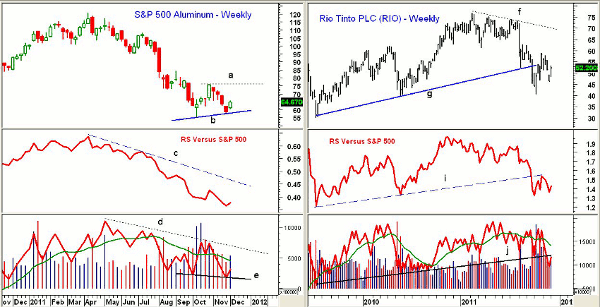
Chart Analysis: The weekly chart of the S&P 500 Aluminum group shows that it formed higher lows, line b, two weeks ago. This could be a double-bottom formation with key resistance now at 76 (line a).
- The weekly relative performance, or RS analysis, broke its uptrend in April 2011 and has since been in a well-defined downtrend, line c
- As discussed last month, double-bottom formations have a typical volume pattern where volume is highest on the initial low and then declines as the second low is being formed
- Volume at the October lows was clearly much higher than it was in November
- Weekly on-balance volume (OBV) has formed lower lows, line e. The OBV is well below its declining weighted moving average (WMA) and the longer-term downtrend, line d
- On a close above 76, the double bottom would be confirmed with upside targets in the 96-100 area
Rio Tinto (RIO) peaked in early 2011 at $76.67 and formed lower highs. RIO cracked support in early August, dropping from $72 to just above $57
- The longer-term uptrend, line g, was broken in late September when RIO declined to a low of $40.50. This was a drop of 47% from the highs
- The RS line also broke its long-term uptrend (line i) and just rebounded to retest this resistance at the end of October
- Weekly OBV shows a similar formation, as it also broke its long-term uptrend, line j, in November. It is below its declining weighted moving average
- Last week’s close was encouraging, but there is resistance at $55.50 and much stronger resistance in the $59-$60 area
NEXT: Latest Charts for Alcoa and China’s Primary Producer
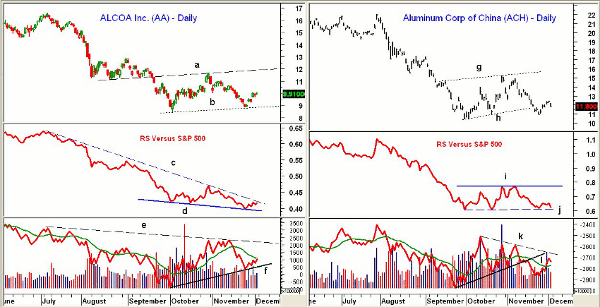
|pagebreak|Alcoa Inc. (AA) has had a rough year, as the stock is currently down over 30% even though it did not make new lows at the end of November, line b. There is next resistance at $10.60-$11.
- A strong close above resistance at $12, line a, would suggest that a double-bottom formation had been completed
- Daily RS analysis has formed lower lows (line d) and shows a well-defined downtrend, line c
- Daily OBV looks a bit better, as it has formed higher lows, line f, but is still below its weighted moving average. A move above the downtrend, line e, is needed to suggest that a low has been formed
- Weekly RS and OBV analysis (not shown) are both negative
- Near-term support stands at $9.58 and then $8.45
The Aluminum Corporation of China (ACH) is a $6.24 billion company whose stock peaked in November 2010 at $26.80 and has since had a rough 2011, having declined by over 48%.
- The daily chart shows that support, line h, was broken on November 21, which was negative
- The completion of the trading range (lines g and h) has downside targets in the $7.80-$8.20 area
- Daily RS is still holding its trading range (lines i and j), but a strong move above the recent highs at line i would be needed to suggest a bottom has formed
- Daily OBV violated its uptrend, line l, in early November, which preceded the recent decline. The daily OBV did form a negative divergence at the recent highs, line k
- There is resistance now at $13.75 and then stronger resistance at $15.30
What It Means: Though I am fairly optimistic about the growth prospects for the emerging markets in 2012, there are no strong signs that the aluminum stocks have bottomed. It would take a few consecutive weeks of higher prices to improve the technical outlook.
How to Profit: I see no reason to bottom fish in the aluminum stocks at this time, but the double-bottom formations should be monitored because if they are completed, it should provide higher-probability entry points in these stocks.


