
Technically-driven FX traders can use this two-step approach to identify the most reliable support and resistance levels on the charts and place higher-probability trades with less risk.
This week I’d like to discuss a topic that comes up in every Online Trading Academy class I teach. It doesn’t matter if it is a forex class in Austin, a professional trading class in Minneapolis, or a futures class in Philadelphia, new traders often have questions about which supply and demand zones to identify on the charts.
The easy answer is, "The most important levels!" However, this isn’t all that clear when you are at home looking at the charts on your own.
One of my first suggestions on level choices is to first determine what kind of trader you are.
The shorter the term of your trades, the more levels you can take. For example, a short-term intraday momentum trader may have levels drawn 20-50 pips apart, while a swing trader may choose levels that are 100-300 pips apart. The further the levels are apart, the more selective you will be in your trades.
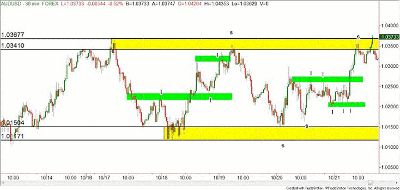
Click to Enlarge
In the above AUD/USD chart, a swing trader may define the yellow shaded zones as the levels he/she will trade, indicating possible entries/exits at the points marked with the "s."
A more active intraday trader may use those levels, but additionally, they’ll use the green shaded supply and demand zones as well, giving more trading opportunities indicated by the points marked with the "I."
The bottom line is you should have a range of pips that is "worth it" for you to trade for. I’m personally not interested in trying to trade for ten pips. With the distance that the spot forex market can move in a few hours or days, I believe most traders would leave a lot of pips on the table with such small targets. If the daily average true range (ATR) is 160 and you are only trying to make ten, I hope you can do that ten times a day!
The next process that goes into choosing our levels is the quality of the level. There are a few odds enhancers that our Extended Learning Track (XLT) program students know, but the easiest to demonstrate here are the departure and arrival speed to the level we are considering.
The basic thought process is this: The faster price leaves a level, the greater the supply/demand imbalance is at that level. When price returns to that same level quickly, there very often aren’t many minor supply/demand zones to stop the same price action from happening again.
NEXT: Another Case Study Using GBP/USD Price Action
|pagebreak|On the below GBP/USD daily chart, you can see two different supply zones, marked A and B. Supply zone A had a fast move away from it (marked as 1), and a fast move back into it (marked as 2).
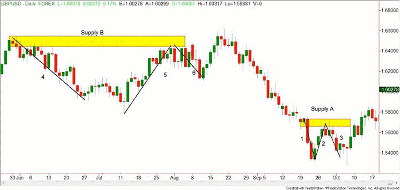
Click to Enlarge
This would lead us to believe that when we left the zone again, the apparent supply imbalance would cause a sharp move, labeled as 3. Since leg 2 took so little time to move back into that supply zone, this would lead us to believe that very few supply and demand zones could have formed on smaller time frames to slow down leg 3.
Now, let’s look at the difference at supply zone B. Notice how the angle of departure is much flatter than the angle of departure from supply zone A. Also, notice all the "waves" in the market as price moved away in leg 4. Each one of those waves has its own smaller levels of supply and demand associated with it.
In leg 5, price action moved into the supply zone, but again there were several waves that happened on that move up. This would lead us to believe that the second move away from zone B would be slow.
Now, compare the distance of leg 3 versus leg 6. With the higher-quality supply zone A, leg 3 moved past the origin of leg 2. See how far leg 6 went down compared to leg 5? It could only retrace about 50% of leg 5. Obviously, you could have still made many valuable pips shorting at supply zone B, but we are focusing on the quality of these two zones.
So, what are the takeaways from this lesson? First, define zones far enough apart that fit your trading style and plan. Not every zone is worth it to you!
Second, choose the higher-quality zones by grading them by departure and arrival speed. This will allow you to take the higher-quality/higher-probability trades, with lower risk and higher reward.
Always remember that we get paid on the quality of our trades, not the quantity.
By Rick Wright, instructor, Online Trading Academy


