
While stock market investors cheer low market volatility; forex traders, not so much. Mike Kulej of FXMadness.com details how you trade in the current environment.
According to a recent report, trading volumes in the foreign exchange market declined drastically in the past few months. In some instances, activity dropped by as much as 30% in September on an annual basis, the lowest level since 2006. This trend became especially pronounced since May, when fears about Greece’s exit from the monetary union began to ease. Most people blame central banks and their policies for lower volatility, which makes it more difficult to be profitable. By some accounts, many speculative interests moved towards stocks, which might present better profit opportunities. Perhaps that is true currently, but these market conditions will not last forever.
The most affected are the Japanese yen pairs, with the USD-JPY showing the lowest volatility level in 20 years. However, most other majors are at similar levels to 2006, before the major price swings of the 2008-2009 period developed. Looking at monthly charts, we can see long-term consolidations, still fallout from the extreme price swings of 3-4 years ago. These consolidations will work themselves out eventually, giving way to new powerful trends. It is that lack of trends that is driving institutional money away from forex. Extreme behavior on the part of market participants often suggests that changes in conditions are just around the corner. We should not be surprised if volatility starts to pick up soon, with new trends emerging perhaps next year.
Click
to Enlarge
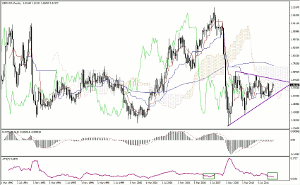
The GBP-USD is a good example of how present volatility compares to historical levels. While it is low, as expressed by the ATR, it is roughly at 2006-2007 levels. We can also see how the price is building a large consolidation, in the form of an irregular triangle. It is not pretty from a technical perspective, but it is still a consolidation. More importantly, because the price is approaching the apex of the pattern, chances are good for a new trend to start within next few price bars—in this case few months.
NEXT PAGE: Signs of Possible Correction
|pagebreak|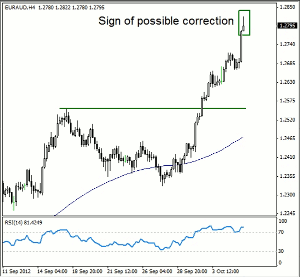
Click
to Enlarge
Meanwhile, from a little shorter perspective, the latest rally in the euro could be overextended to some degree. I do not necessarily expect a reversal, but a pullback is very likely. In some pairs, like the EUR-AUD that might be substantial. Currently at around 1.2800, this pair just formed a shooting star on the 4H chart, which is often the first sign of corrective move ahead. Here the logical objective is 1.2550, the previous resistance, now a possible support.
Click
to Enlarge
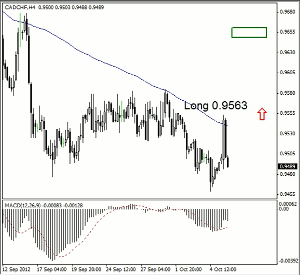
The CAD-CHF has also had a decent trend recently on the intermediate term chart. It has already fallen about 500 pips, dipping to 0.9460. Given length and size of this selloff, the possibility of a corrective rebound is good, too. My plan is to track the latest minor high with a buy order, currently at 0.9563. If this order is triggered, the objective will be 90-100 pips, which could change in the event of another low. In such event, the order will be readjusted to the next minor high. For now, opening gaps could create short-term trading opportunities, if they develop.
Mike Kulej can be found at FXMadness.com.


