
The US dollar index has been range-bound for almost five months now, and traders—not just forex traders—would be wise to pay attention to its direction, says trader Anna Coulling of AnnaCoulling.com.
It’s a trading fact that regardless of the market or instrument you are looking to trade (or invest in) one of the most important charts you should always keep a very close eye on is the USD Index.
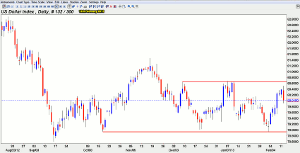
Dollar Index Daily Chart 12 Feb 2013
Click
to Enlarge
Non-forex traders may find this strange. After all, what does a chart which tracks the performance of the US dollar against a basket of other currencies have to do with equities, options, bonds, or even commodities?
The answer is everything.
Because, like it or not, the US dollar is still the lynch pin of the financial markets around which everything revolves.
Commodities are priced in dollars and US treasury bonds are where traders and investors run to, when market sentiment turns negative. So, any insight into the likely direction of the US dollar can only benefit traders and investors alike.
From a technical perspective the daily chart of the Dollar Index is at a most interesting point. Since September 2012 the Dollar Index has been trading in a relatively narrow range, and since December this has tightened still further. The floor of current support is now firmly in place in the 79 region with the upper level of resistance just below at 80.70 on the daily chart. In today’s trading session the index once again attempted to continue its recent bullish trend, but has failed to follow through, adding a further level of resistance to the current congestion.
The message behind the current price action in the dollar index is one of ‘trader beware,’ because by trading in this narrow range what the index is revealing, is a market lacking direction and waiting.
This may seem a strange thing to say, given the recent rise in equities and world indices making new yearly highs. However, last week the range in the Dow was only 170 points. The week before, the range was only 159 and you have to go back to September 2012 (as with the index) to find a week in which the range on the Dow was less than 200 points. This type of price action is reminiscent of a coiling spring and is warning us that something big is on the verge of happening.
So, until the index breaks away (either to the upside or the downside) our trading watch word is ‘caution.’
By Anna Coulling, Professional Trader & Blogger, AnnaCoulling.com


