
The gold universe show growing signs of renewed strength, suggests technical expert Omar Ayales, editor of Gold Charts R Us — and a participant in MoneyShow's Metals & Mining Virtual Event on April 20-22. Register for free here.
Price action in the U.S. dollar is key since its the personification of the inflation/deflation dilemma. Dollar strength in itself is deflationary and dollar weakness is inflationary. The rise or fall of the dollar, as well as its probable path are great indicators for inflation expectations.
The amount of stimulus and the record setting savings rate among Americans will sooner or later seep into the economy and push inflation higher; its expectations could run wild. But I do believe that once the effect of the stimulus wears off, the economy could pull back to a more stable trend of growth.
However, it is to be seen what happens after the dollar reaches the January uptrend & support level. Will the dollar break down and move lower, or will it hold at its Jan uptrend?
It is yet to be seen and there are strong arguments for both sides. We don’t have to decide just yet, but we must be open to all arguments and sensitive to price movement; be disciplined about taking profits when targets are reached.
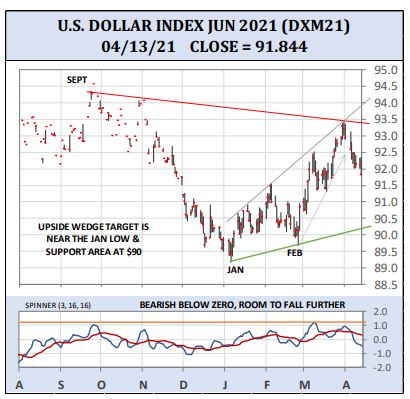
Our strategy this week is to keep an eye on the weakening dollar. It could continue pulling back to the January 90 level. It’s decline could spur inflation expectations and it could continue driving assets up short-term, across the board.
Gold continues to bounce up. It broke above a downside wedge pattern, to a new 1+ month high! Price action is very bullish for gold. It’s testing key resistance at $1750. A break above this level and it’s off to the races. A rise to the August downtrend near $1900 would be likely.
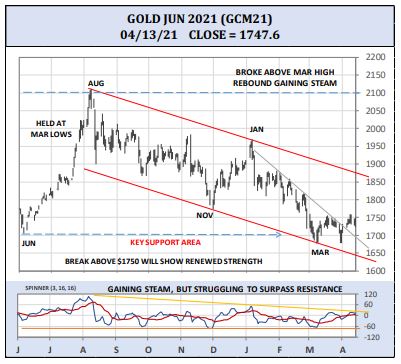
Spinner — our technical indicator — is is still under pressure below a downtrend. But also notice it's been developing an uptrend since early March lows, suggesting momentum is rising. Keep your positions for now. A stronger upmove seems imminent.
Silver is forming a symmetrical triangle between a downtrend since February and an uptrend since November. The uptrend is formed from two key lows, the November and March lows, showing a solid uptrend.
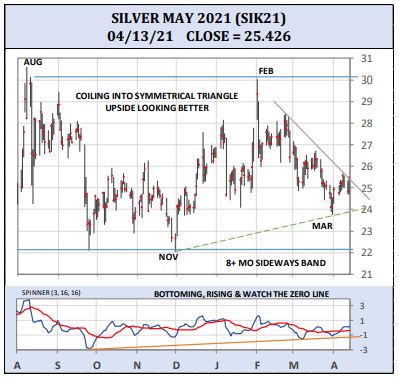
The decline, a bit steeper, shows weakness. Keep an eye on $26. A break above this level confirms the November uptrend and could push silver to its August/February highs near $30.
B2 Gold (BTG) is looking very good. I have a full position but I’ll be buying more at market. Notice on the chart, BTG is breaking above the bullish downside wedge pattern with upside target near $6, the August downtrend.
Moreover, the breakout was lead by Spinner breaking above zero and into bullish territory. The leading indicator is now showing more upside potential. Keep your positions and buy a bit more at market.
NovaGold (NG) is also doing great. It extended its rebound rise, breaking above the September downtrend showing signs of strength. NG is bullish above the March uptrend and has deep support at $8.
If NG now stays above the March uptrend near $9, a continued rise to the double top resistance near $12 would then be likely. Keep your positions. If you are not in or looking for growing exposure in gold miners, consider buying at market.

Silver miners remain very volatile. Our positions for the most part are looking strong. Hecla Mining (HL) continues to ride the March 2020 uptrend. HL is very strong above $5.50 and has deeper support at $4.50.
Its leading indicator is rising from an extreme, breaking above zero. Spinner suggests momentum could pick up steam sooner than later. Watch for a break above $6.50, it could open the door to a continued rise to the top side of the March upchannel near $9.


