
A lot of traders use Elliott Wave these days to look at charts and find good patterns to trade. Wave Trading points out why the recent SPX trend appears to be flashing a bullish signal.
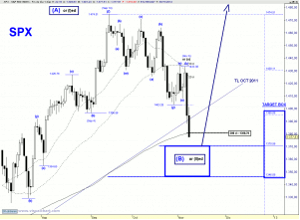
Going forward I will try to keep my emotions aside since SPX is now inside the target box that should contain the pivot price that will establish the end of the corrective EWP off the September 14 high.
As you already know, for many weeks I have been discussing that the internal structure of the pullback in progress can only be counted as corrective, therefore price should be involved in retracing a Fibonacci retracement of the up leg from the June lows.
Once/if price confirms a bottom the intermediate up trend (From the 2009 lows) will resume within the incomplete “bearish” wave (X). So now only price can confirm or invalidate my scenario.
To make it easy: A multi-week/month bottom is never established right away, it needs to carry out a process that requires some time in order to have a completed EWP, which will occur with fear and positive divergences.
Obviously a catalyst is needed in order to accelerate the price reaction into a terminal pattern.
I can think of two potential news:
- Spanish bailout
- US resolution of the “fiscal cliff issue”
So now we need a market turmoil to begin the bottoming process (It will speed up the negotiations process).
Let’s go to the charts: By looking at the daily chart below, if you have basic EW knowledge, you should understand why I maintain a bullish stance. It is not possible to count the pullback as impulsive; hence the outcome of this EWP should be bullish.
Click to Enlarge
So I remain confident that price is unfolding a complex double or triple three.
Since neither at the 200-day moving average has there been buying interest, the target box is decreasing in size, now the range is between 1370 & 1346. I will not try to pick the low tick, something that probably many traders tried Thursday hoping the 200-day moving average was the key level.
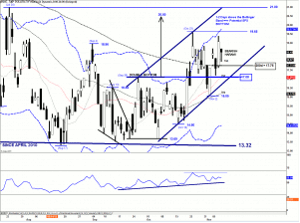
Probably this is the explanation why VIX did not explode higher as early bottom fishers may have dumped volatility put options and went long SPX. Any way it is very odd.
But the internal structure, despite Thursday’s bearish Harami is still suggesting that we have not seen yet the top. Hence as long as VIX does not breach the pivot support at 17, I expect a move above the October 23 peak at 19.65 that should occur with a negative divergence of the RSI.
Click to Enlarge
If VIX has more business to the upside we already know that SPX has more business to the down side. Usually when/if a daily VIX candlestick is above the upper Bollinger Band we will have a serious warning that SPX (Proxy for equity indices) should be establishing THE BOTTOM.
One more comment:
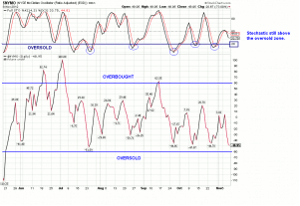
Since Thursday the positive divergences of SPX daily RSI and the McClellan Oscillator have been erased. I suspect that price during the assumed bottoming process will shortly have to test lower levels in order to allow positive divergences.
In the McClellan chart below we can see that the Oscillator has reached the range where, during the June up leg, price has reversed to the upside, but this time the Stochastic has not entered the oversold zone yet.
Click to Enlarge
It seems that the equity market wanted a change in the White House, maybe because it is aware of the an approaching end of the wave (X).
By WaveTrading Contributor to SharePlanner.com


