
State of the market: The bond market gets closer to an all-in bet on recession as stocks give back half of their post-Thanksgiving rally gains in one day, writes Dr. Marvin Appel Wednesday.
The S&P 500 Index (SPX) had its best week since 2011 with a gain of 6.1% from the November 23 close through December 3. But on December 4 it gave back more than half of those gains in the worst day since February.
The bond market may provide an explanation. From late August through early October, 10-year Treasury yields rose while high yield bond prices also rose. This was consistent with expectations of a strong economy.
However, in October, Treasury yields stopped rising and high yield bond prices turned down. In the past four weeks, Treasury yields have fallen while high yield bond prices have also fallen. The developments in October-November are consistent with expectations that the economy will slow down.
The model we use to trade floating rate bond funds for clients also recently gave sell signals for the first time in almost three years, confirming a potentially pessimistic bond market outlook on the economy.
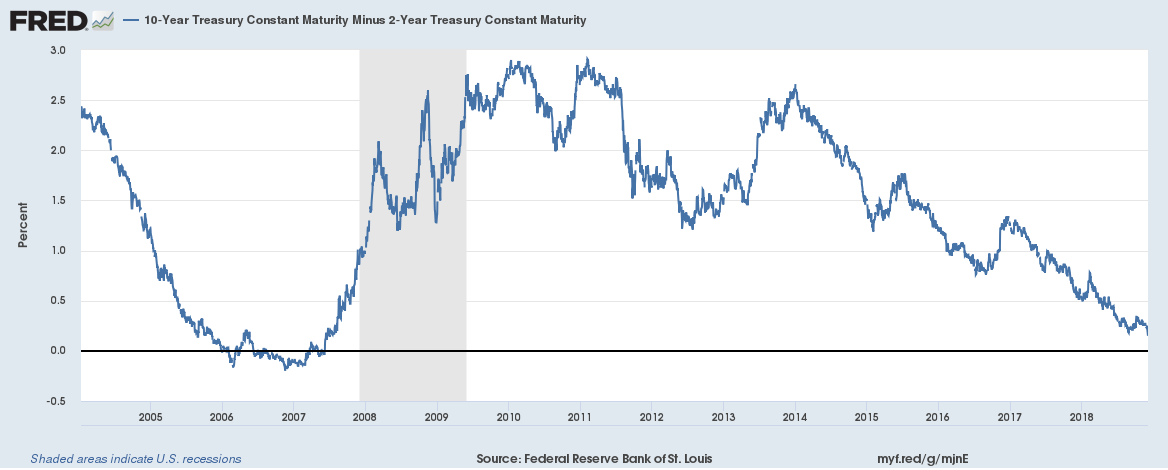
The last piece of the puzzle is the yield curve (difference between 2-year and 10-year Treasury note yields). Historically, instances when two-year yields exceeded 10-year yields have always been followed by a recession (with the possible exception of June 1998), although sometimes with a lag of as much as two years.
On December 4, 10-year yields were only 0.11% (11 bp) above 2-year yields, the narrowest spread since 2006. (See figure above.) Narrow spreads do not count; only true yield curve inversions where 2-year yields exceed 10-year yields have served as a recession warning historically. This bears watching. (No pun intended.)
Technical analysis offers some optimism for the intermediate term (weeks to months).
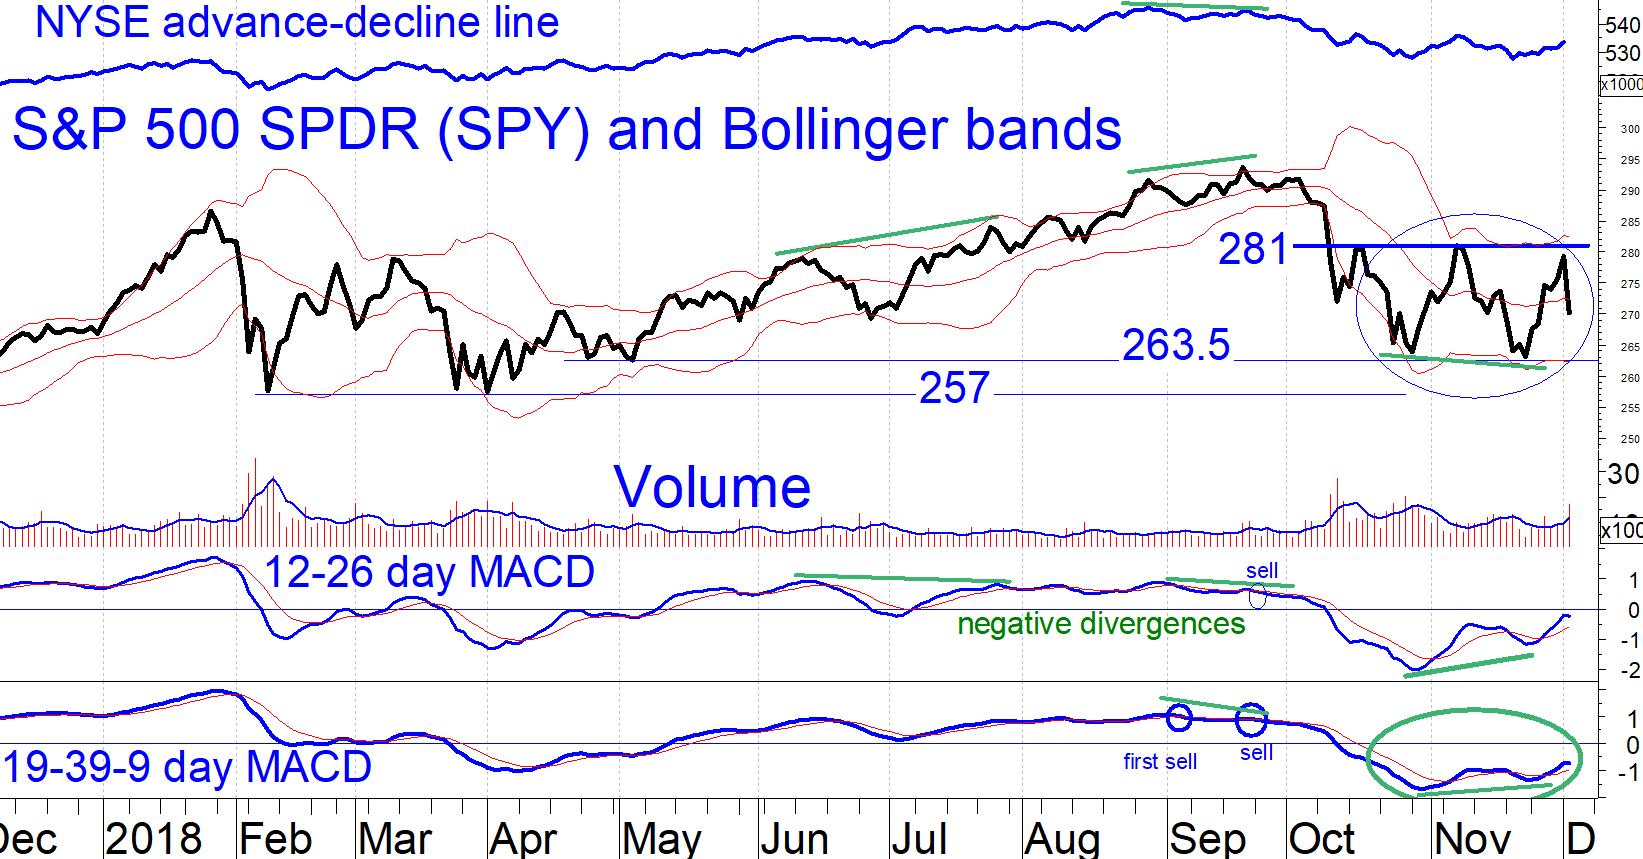
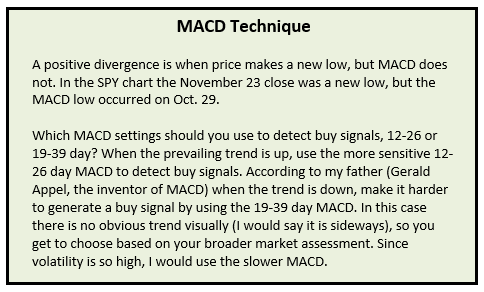
First, the S&P 500 SPDR (SPY) chart above shows positive divergences between price (circled in blue) and both the 19-39 day MACD (circled in green) and the more sensitive 12-26 day MACD. This is a Buy signal. (See inset below for explanation.)
The nearest sell stop would be if the 19-39 day MACD made a new low. If, before that happens, the 19-39 day MACD gets above zero, then the Sell signal is a crossing by MACD from above to below its signal line.
High yield bonds have broken down but they too are showing signs of having made an intermediate-term bottom. The chart below of the iShares High Yield Bond ETF (HYG) shows how HYG has reached a downside objective projected after its recent breakdown below 84.90.
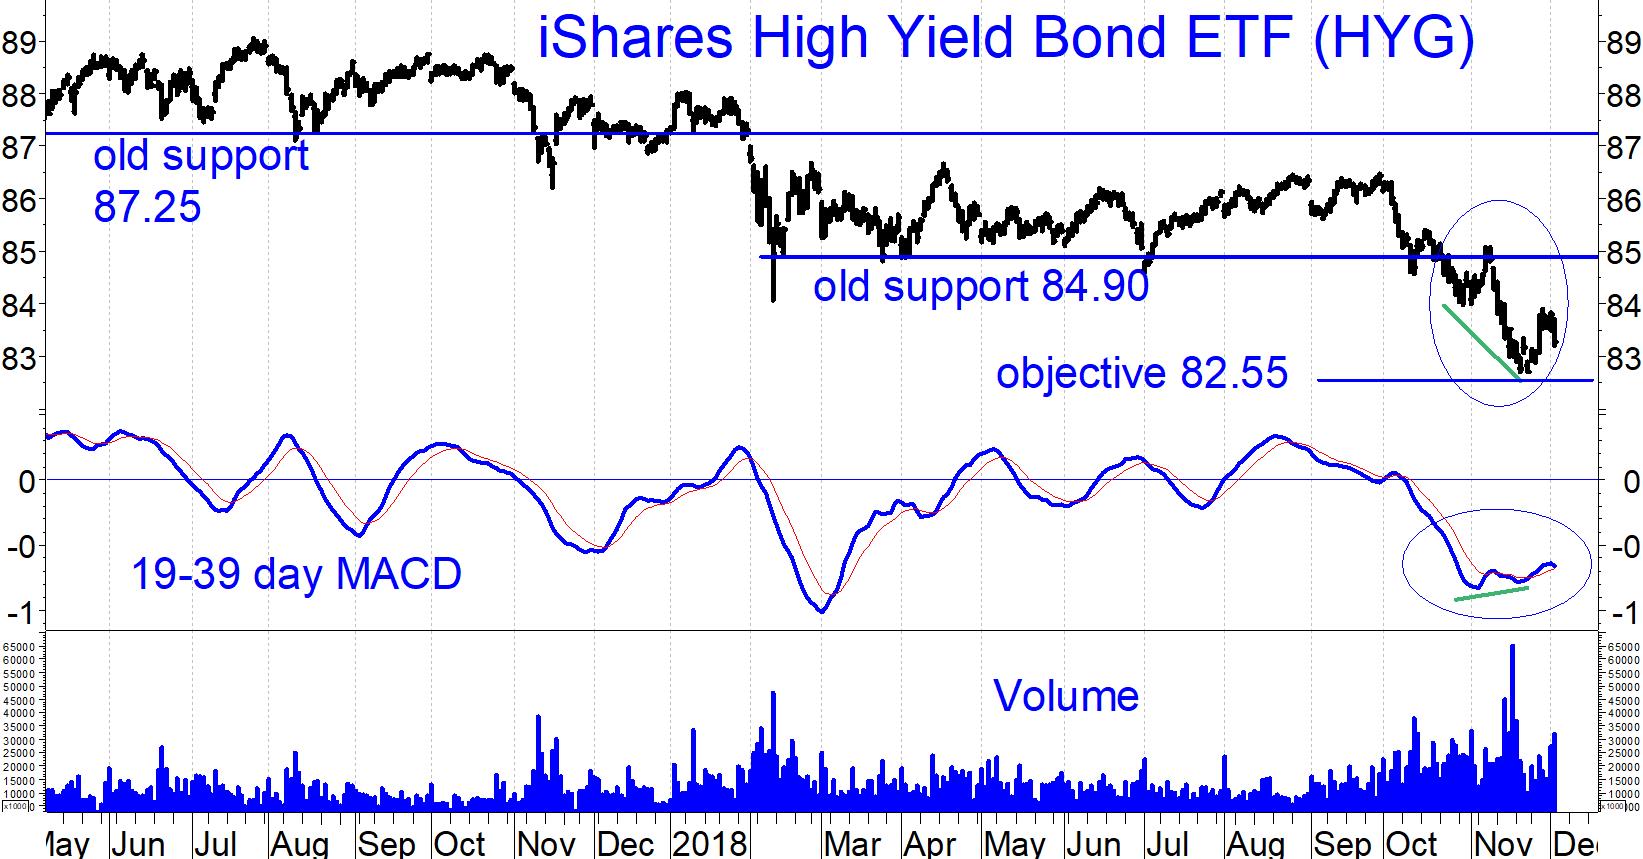
As with SPY, it has formed a positive divergence with its 19-39 day MACD. However, unlike SPY, it has not formed a positive divergence with its 12-26 day MACD, and HYG remains in a two-month downtrend while SPY potentially hit bottom back on Oct. 29.
For these reasons, I would say that HYG looks weaker than SPY.
Implications: Respect all Sell signals
The bond market implications are clear: Respect all sell signals. Sentiment may turn bullish again, but it is better to follow the market’s trends rather than to try to anticipate a change in expectations.
If I were an economist, I would be concerned about what the bond market is telling me, even though all economic indicators remain quite rosy for now and will likely remain so for at least the next several months.
An inversion of the yield curve would complete the evidence that we could be facing a recession within two years at the latest, which would have bearish equity implications months before the economy actually peaks.
It is more difficult to discern what to do about stocks. Our roster of equity models is mixed, with some on Sell signals but with our main U.S. equity timing model still on Buy. The example of history says that so far, everything we have had to endure lies within historical precedent.
Therefore, my recommendation is to continue to ride out the storm in the expectation that the Oct. 29 and Nov. 23 lows will not be significantly extended.
Stick with SPY or defensive sector ETFs such as XLP (consumer staples). Avoid international equities, particularly European equities. However, emerging markets may present a bottom fishing opportunity once the market finishes bottoming. This will be the topic of an article in the next issue.
—Marvin Appel
Sign up here for a free three-month subscription to Dr. Marvin Appel’s Systems and Forecasts newsletter, published every other week with hotline access to the most current commentary. No further obligation.
View Marvin Appel discussing MACD bond signals in a short video here.
Recorded: TradersExpo Las Vegas, Nov. 13, 2018.
Duration: 2:56.
View Marvin Appel discussing MACD buy signals for equities in a short video here.
Recorded: TradersExpo Las Vegas, Nov. 13, 2018.
Duration: 3:41.
View a video interview with Marvin Appel and Dan Gramza on 2018 investing opportunities here.
Recorded: July 25, 2018 at TradersExpo Chicago.
Duration: 6:30.
View a video interview with Marvin Appel and John Bollinger on Bollinger Bands, when they are most useful for traders and about systematic investing pioneered by Dr. Appel and his father Gerald Appel here.
Recorded: July 25, 2018 at TradersExpo Chicago.
Duration: 4:31.


