
This is going to be a long weekend as we wait for the markets to reopen on Tuesday, but there are some bright spots, writes MoneyShow.com senior editor Tom Aspray.
Last week, the hopes that the economy was not really that bad were supported by some of the economic data (such as auto sales) turning out better than expected.
The tone changed Thursday, as stocks opened weak, then rebounded sharply as the ISM Purchasing manager’s report came in stronger than expected.
The rebound was short-lived. New concerns over Bank or America (BAC) and Goldman Sachs (GS) helped stocks to reverse to the downside. The very weak close suggested that the rebound from the August lows was likely over.
Then the dismal monthly jobs report hit stocks hard Friday, as stocks opened sharply lower and the major averages closed near the lows.
The rally was classic in technical terms, as the Spyder Trust (SPY) came very close to retracing 50% of the decline from the July highs. Most of the major averages traced out flag formations, which are normally seen as interruptions in the downward weekly trend. I will share some more specifics below.
Click to
Enlarge
The key question is whether the support zones derived from the recent rally will hold. If they do, we could see the formation of a short-term double bottom that would set the stage for a better rally.
The other alternative is that we will crash below the August lows and head to stronger support, but well below current levels.
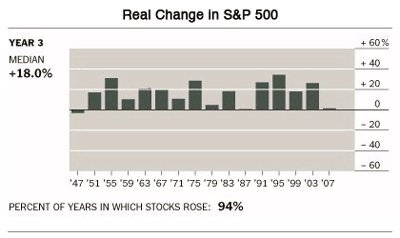
There are some conflicting seasonal and historical trends that may give us some insight. The chart above, from The New York Times, shows that the third year of a presidential cycle is normally the best for stocks, showing a median gain of 18% since 1946—and 94% of the time, stocks rose in the third year.
To give you some perspective, the S&P 500 closed 2010 at 1,257.64, and is currently about 6.2% below this level.
Click to
Enlarge
This clearly casts a positive historical light on the last quarter of the year...but first we have to survive September.
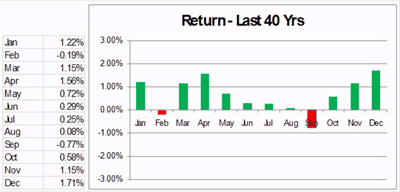
As this second chart reveals, over the past 40 years September has been the worst month of the year by a significant margin. February was the only other consistently lower month.
The sharply lower close in the US is likely to set the stage for further weakness after the holiday. It is thus likely that the global markets may be hit Monday, so this could carry over to Tuesday’s opening in the US.
Of course, we may try to stabilize by mid-week, as the nation gets ready for President Obama’s Thursday night speech.
With the negative trend in the economic reports over the past month, the market may not be ready for the ISM Non-Manufacturing Report due out on Tuesday. The rest of the week is pretty light, with the ICSC-Goldman store sales and the Beige Book out on Wednesday.
On Thursday, we get the weekly unemployment claims and data on international trade. Ben Bernanke is also scheduled to speak in the afternoon, with Obama on tap that night.
NEXT: What to Watch
|pagebreak|WHAT TO WATCH
Click to
Enlarge
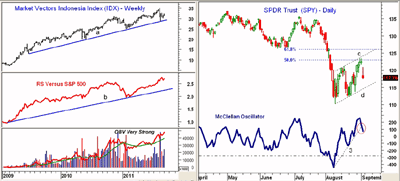
As I discussed early last week, many of the major commodity indices and the broad-based commodity ETFs and ETNs appear to have completed their corrections.
This may have important implications for some of the emerging markets, as many have charts that are much more constructive than those of the US or European market averages. One of the best continues to be Indonesia; the chart of the Market Vectors Indonesian Market Index (IDX) shows that the early August drop just took it back to its long-term uptrend (line a)
.
The weekly RS analysis is in a strong uptrend, as IDX continues to outperform the S&P 500. The weekly OBV is acting much stronger than prices, and it made a new high this week even though IDX is almost 10% below the July high of $34.99. This makes a new high in IDX very likely.
Stocks are likely to decline into the middle of the week. If stocks can then rally sharply, the technical outlook will improve.
S&P 500The Spyder Trust (SPY) gapped lower Friday and closed near the lows. There is further support in the $116 to $117 area, with the uptrend (line d) in the $114.70 area.
A close below this support will suggest a decline to at least $112.40, if not the August lows at $110.27.
The rally reached the upper boundary of the flag formation (line c) and came within 20 cents of the 50% Fibonacci retracement resistance.
The McClellan oscillator, which hit a low of -446 in early August, rebounded all the way to +266 last Wednesday before turning lower Thursday. It closed Friday in the +60 area, and has broken its uptrend (line e).
Russell 2000The small cap iShares Russell 2000 Index Fund (IWM) also peaked Wednesday, and followed Thursday’s weak close with a gap to the downside. There is minor support now at $66.50 to $67.50, with the lower boundary of its flag formation at $65.43.
The downside target from the flag formation is in the $56 area. There is a band of strong resistance now in the $71.40 to $74 area.
The Russell 2000 A/D line has just rebounded to resistance, and have now turned lower. It is acting weaker than prices, as it is closer to the August lows.
NEXT: Dow and Sector Focus
|pagebreak|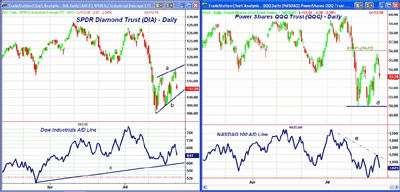
Click to
Enlarge
Dow Industrials
The Spyder Diamonds Trust (DIA) dropped more than 2% on Friday, after rebounding early Thursday to just above $117.
The flag formation has key support now at $110.40 (line b). If this is broken, it will suggest a drop to the $108 level, or even further to the zone between the August lows ($105.94) and the major 38.2% support ($105.46).
The Dow Industrials A/D line has turned down sharply, and has important support now (line c).
There is strong resistance for DIA now at $114 to $115.
Nasdaq-100The PowerShares QQQ Trust (QQQ) was hammered hard Friday—down over 2.5%—but the daily chart does look better than that of SPY or DIA. There is a potential double bottom now in the $50 area (line d).
QQQ had the strongest rally last week, as it came very close to the 61.8% retracement resistance at $56.07. There’s good support now in the $52 to $52.55 area, and then at $51.
The Nasdaq-100 A/D line has turned lower, and it will be important that the recent lows hold. A move back above the downtrend (line e) would be positive.
Sector FocusThe iShares Dow Jones Transportation Average ETF (IYT), as I mentioned last time, was the only one to make new correction lows in the past two weeks. It was one of the weaker sectors Friday, as it was down 3.5% for the day.
If it is going to bottom ahead of the other major averages, it will need to stabilize soon. IYT has next support at $78, with the recent lows following in the $75.81 to $76.40 area.
The Select Sector SPDR Utilities (XLU) was down less than 1% Friday, and continues to hold up the best of the major sectors. It has good support in the $32 to $32.50 area, and is still my favorite sector for new buying once the overall market stabilizes.
The next strongest sector is the Select Sector SPDR Consumer Staples (XLP), which was down only 1.2% Friday, and has good support now in the $29.50 to $30 area.
NEXT: Commodities, Bonds, and Tom's Outlook
|pagebreak|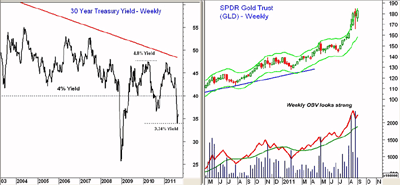
Click to
Enlarge
Oil
October crude oil closed down over $2 on Friday, and as I pointed out Friday morning, it shows a very similar formation to the Spyder Trust (SPY).
The lower boundary of the flag formation in crude is at $85.30, and should be watched closely. A break of this level may precede a break of support in the SPY by a day or so.
Interest RatesThe surge into Treasuries continued last week, as the yield on the 30-year T-Bond hit a new low for the week at 3.31%. It has dropped from a high early in the year of 4.64%.
The long-term chart shows no signs yet that the decline in yield is over, but the bonds are definitely overextended.
Precious Metals
Gold prices again accelerated to the upside last week, as the Spyder Gold Trust (GLD) added another 5.3% on Friday. Once again the close was at the weekly Starc+ band, which still makes a correction likely, but for now the market is charging higher.
One more increase in margin rates may be needed to dampen the enthusiasm, and it could come this week. The wider weekly ranges do reflect an increase in volatility.
The iShares Silver Trust (SLV) gapped higher Friday, but is still below the recent high at $42.78. A breakout does look likely, but the $44 to $45 area will likely limit the upside.
The Week Ahead
The coming long weekend looks like it may be even longer for investors. There is little on the horizon to suggest that stocks will be able to open higher on Tuesday. It would take a sharp improvement in the Euro crisis, or some other dramatic development from the Fed or the central bankers, to stop the slide in stocks.
If stocks can stabilize late in the week, it could lessen the high level of fear in the market. Unfortunately the bearish sentiment has not yet reached levels consistent with a market bottom.. My advice is to enjoy the long weekend and forget about the stock market until next week.
Don't miss Tom's latest Trading Lesson, "How to Get Started in Chart Reading."


