
To capitalize on special Kairos moments, first, you must have the patience and discipline to wait. Then see these clusters line up at key points, asserts Jeff Greenblatt, director of Lucas Wave International and editor of The Fibonacci Forecaster.
Get Trading Insights, MoneyShow’s free trading newsletter »
Last month I showed you how price and time square outs/vibrations can lead to a good trading move in the Forex arena.
To summarize, Gann said when price and time square the pattern changes direction. Gann never had access to the powerful technology in the 21st century. We are blessed to be able to scale down and find the Kairos moment, that supreme moment where everything lines up.
In this case, we are working on the 1-minute YM from last Thursday. You’ll remember it as the mini-crash when the news event of Bob Mueller impaneling a grand jury manifested. As an important aside, the market has shown us all year it does not like anything getting in the way of the Trump growth agenda since tax reform is already baked in the cake.
But the real setup materialized way before the big drop. Those of you familiar with my work know I’ve been working with Fibonacci cycles for years. These cycles work on a monthly, weekly and all the way down to a 1-minute chart. In this case, a high to high retest of resistance peaked at 233 (Fibonacci) minutes. Additionally, the prior high leading to the 233-minute-high was 33 minutes. So, there was a cluster. Never front run the bars because markets will not always turn on a Fibonacci cycle so it’s no panacea. But when they get to key strategic points on the chart, such as support or resistance there is a much greater probability of success. In this case, resistance turns out to be 233 which is a key Fibonacci number but also at 21987 where the 987 aspect is also a Fibonacci number.
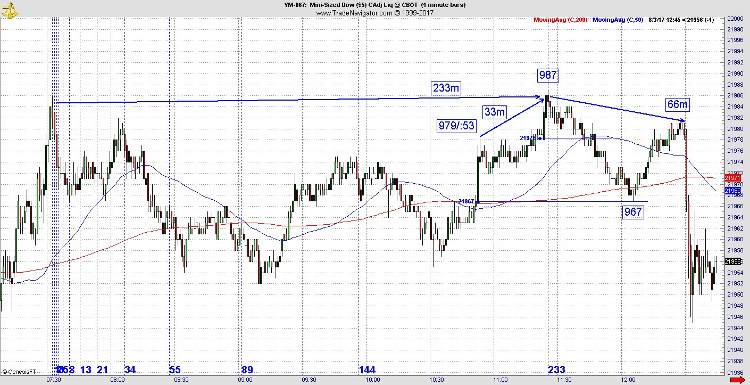
Resistance turned out to be an interesting mix of price and time. It started to drop and found support at the breakout point of the prior leg up, the base of the wide range green candle. That was a strong area for buyers. They tested and defended well.
Here’s where price and time get interesting. The bounce from 967 balanced at 66 minutes from the prior high. The drop started on the 66th minute which is a margin of error of one. At first, it was hard to understand why the pattern turned into a ski slope. But when I turned on the television I found out special counselor Mueller impaneled the grand jury which is a major news event.
Some traders like to play news events. This is a big mistake as sometimes the market will react favorably, other times not so much. It will depend on where we are in the cycle. As we’ve seen with earnings, in a bubble-like environment if earnings are not priced to perfection they can get taken to the woodshed. In terms of important news events, I discovered many years ago the time cycle will develop and the news event will suddenly manifest. The best a trader should hope for is learn an advanced strategy which will enable him/her to be lucky because they are very good. Who could have predicted Thursday’s news to the point they could profit from it?
This setup is somewhat advanced even for the person who understands Fibonacci work. The reason is the real drop comes in two phases.
The first one is simple, because for the most part, it is a turn on a basic cluster of Fibonacci readings. But many times, the big move is hidden by a price and time squaring vibration which is revealed here whether accompanied by a news event or not. In this case, the balance comes because of the 66/67 vibration balancing or squaring out. To be fair, the drop was quick and difficult to catch this time but many traders may have sold short in the first sequence and held on if they were not scalping. Luckily many drops don’t manifest as fast as this one did. One does not have to trade a 1-minute chart to capitalize on these special Kairos moments. They appear in all time frames.
But the key to success is two-fold. First one must have the patience and discipline to wait. The other consideration is seeing these clusters line up at key strategic points such as support or resistance.


