
The year 2018 has been one of the more interesting lately in terms of market volatility. We’ve had a chance to see both ends of the volatility spectrum – ultra-low volatility and a financial-crisis like spike in the VIX, writes Jay Soloff Friday.
It’s not often that both sides of the scale are in play in the same 12-month period.
As a reminder, the VIX is the most popular measure of market volatility. It’s the CBOE’s S&P 500 implied volatility index (VIX) and it’s based on S&P 500 (SPX) options prices. Investors mostly use VIX as a gauge of investor concern over market conditions. Generally speaking, the VIX goes up when stocks go down (because more people are buying options for protection).
This past year we’ve seen VIX levels of both 9 and 50…obviously quite the divergence. We started off the year with the volatility index dropping below 10 after seeing very little volatility for most of 2017. Then in February, the market sold off and volatility spiked to about 50 before settling down in the coming weeks.
Since then, volatility has come back down to more normal levels, with a floor of roughly 12 in the VIX. We’ve had a few minor spikes around various tariff concerns, but the general volatility trend has been downward.
Why hasn’t there been more volatility? Quite simply, the economy is doing well enough right now to ease any other major concerns.
While the political situation in the US has been volatile, the economy still appears to be firing on all cylinders. In fact, the biggest concern isn’t what news comes out of the White House or Capitol Hill, but what the Fed says about the future of interest rates. However, with the most recent FOMC meeting going off without a hitch, there currently isn’t a lot of interest fear in the market at the moment.
A massive long volatility trade in iPath S&P 500 VIX Short-Term Futures ETN (VXX) certainly caught my attention recently. Keep in mind, VXX is an ETN which trades the first two futures months of VIX. It’s the easiest and most popular way to trade short-term volatility. (The VIX itself is not tradable, just its futures and options on the futures.)
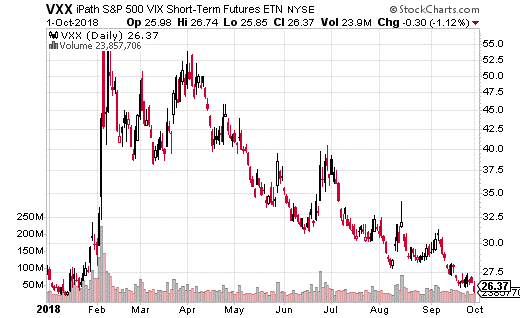
The trend in volatility has definitely been down, as you can see in the chart of VXX below.
So why would someone place a massive long VXX trade? Let’s take a closer look.
An obviously well-capitalized strategist purchased the VXX January 2019 33-35 call spread (buying the 33 call, selling the 35 call) for a total of $0.31. The call spread was executed an eye-popping 48,000 times. Breakeven for this trade is $33.31, with max gain at $35 or above at expiration in January.
The call spread trader is risking about $1.5 million in premium on the trade (and will lose it all if VXX doesn’t move above $33 prior to expiration). On the other hand, the trade can rake in over $8 million if VXX shoots higher in the next few months.
The most obvious conclusion: this is a cheap hedge against a market selloff (although it possibly could be a speculative bet on higher volatility). We do have midterm elections in November which carry a lot of weight, considering control of Congress could change hands. There also could be new economic data by January which alters the Fed’s course on interest rate policy.
Whatever the reason, I love this trade and highly recommend it. Spending $0.31 with a chance to make $1.69 (over 500% return) is really a great risk/reward profile for over three months of holding time. This is a cheap and easy trade to make whether you are hedging against or speculating on higher volatility by mid-January.
Watch Jay Soloff: Successful Options Trading.
Recorded: MoneyShow San Francisco, August 24, 2018
Duration: 3:31.
Watch Jay Soloff’s Interview: How I Trade Volatility.
Recorded: TradersExpo Chicago, July 24, 2018.
Duration: 5:46.
Watch Jay Soloff's Interview: Education for Options Traders
Recorded: MoneyShow Las Vegas, May 9, 2018.
Duration: 3:22.
Subscribe to Jay Soloff's Options Profit Engine here…
Click here to stop struggling and start winning.


