
In part one of this three-part series on the small trader sentiment, I introduced The Daily Sentiment Index as an objective metric for assessing the level of bullish or bearish levels of “small” traders, writes Jake Bernstein. He's presenting at TradersExpo Las Vegas.
The overarching concept that motivated this project which began in 1987 was to determine if small trader sentiment was a valid predictor or leading indicator of market tops and/or bottoms.
Now that we have collected data every trading day since 1987 on all active U.S. futures markets and for a lesser period of time European equity and index futures, we have more than sufficient data to reach a number of objectively supported conclusions.
Before sharing with you what we have learned from our vast and extensive efforts, let’s look at the weekly version of the daily chart I showed you in the last part of this series.
Shown below is the weekly S&P futures chart with the raw Daily Sentiment Index shown at the bottom of the chart. I have highlighted with vertical bars areas of “excessive” small trader bullishness and “excessive” small trader bearish sentiment. As you can see from a cursory examination the correlation appears to be significant with small trader sentiment being a leading indicator or time current indicator of short-term tops and bottoms.
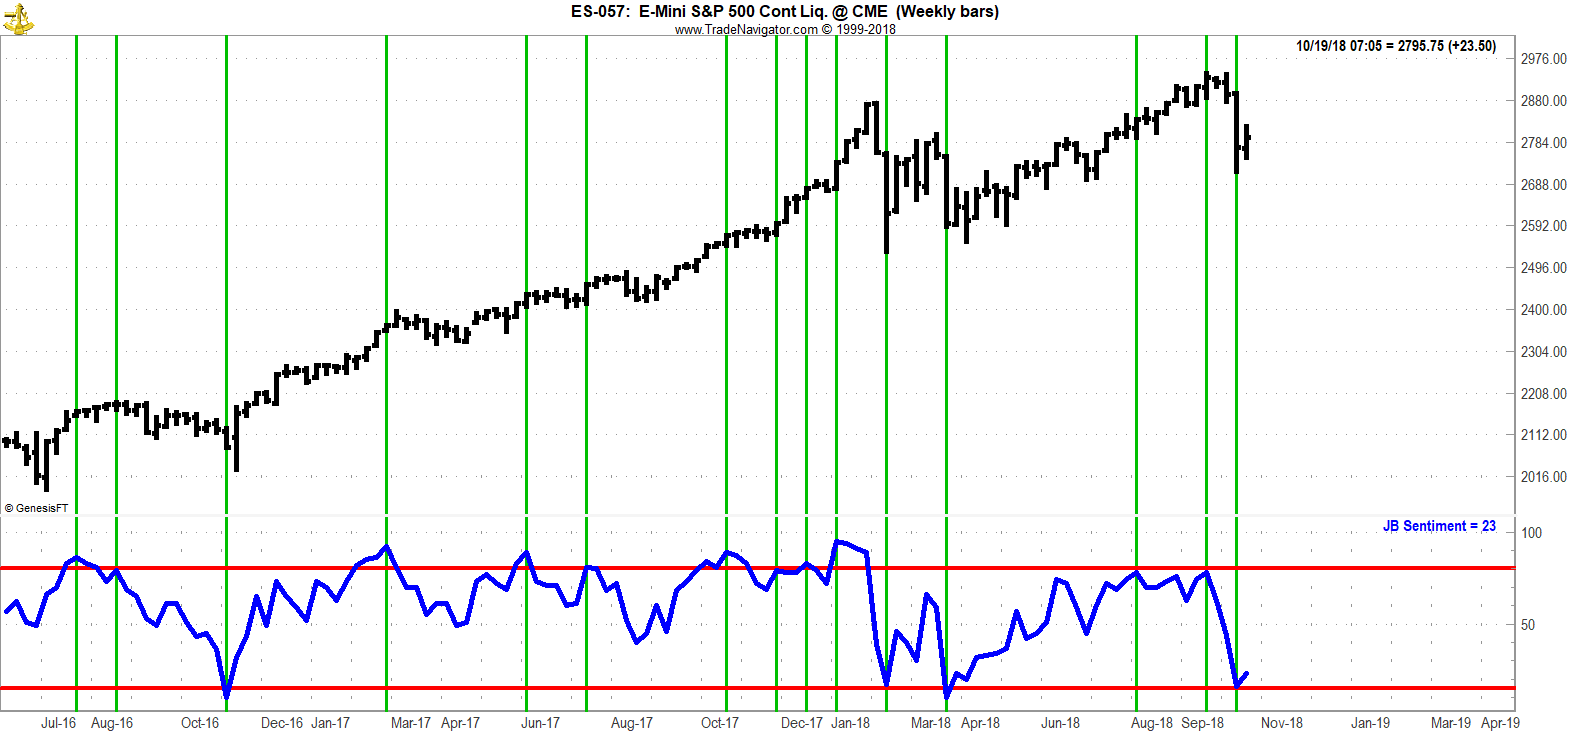
In part three of the series I will share my conclusions with you. Until then, however, I invite you to consider now the weekly S&P futures chart with weekly sentiment DSI showing correlations of tops and bottoms with excessive levels of market sentiment.
What do you conclude?
As the old joke goes, “how do you keep a trader in suspense?”
I will tell you next time, but in the meantime observe and think…but don’t overthink.
Best of trading!
Jake Bernstein
More information: trade-futures.com


