
Headline risks are everywhere, much like coeds on South Padre Island in March. Keep your head on a swivel and human reactions in check so you’re not drawn into well-written narratives that promise to unveil the mystery of financial markets, writes Landon Whaley.
This week’s “Headline Risk” focusses on the risk of using a single data point as the basis for a market perspective.
This week’s risk comes courtesy of CNBC quoting Goldman Sachs chief economist Jan Hatzius on inflation: “… we see risks to this forecast as tilted to a bigger increase.” He’s calling for inflation to pull a Superman and go up, up and away, and his rationale is a single indicator: wage inflation and its recent acceleration.
Anchoring a market perspective to a single indicator and allowing recency bias to run wild is standard operating procedure on Wall Street.
In contrast to this “old Wall” SOP, we build our market perspectives (which are often contrarian calls) using our Gravitational Framework which utilizes multiple factors over multiple durations across both economic and financial market data.
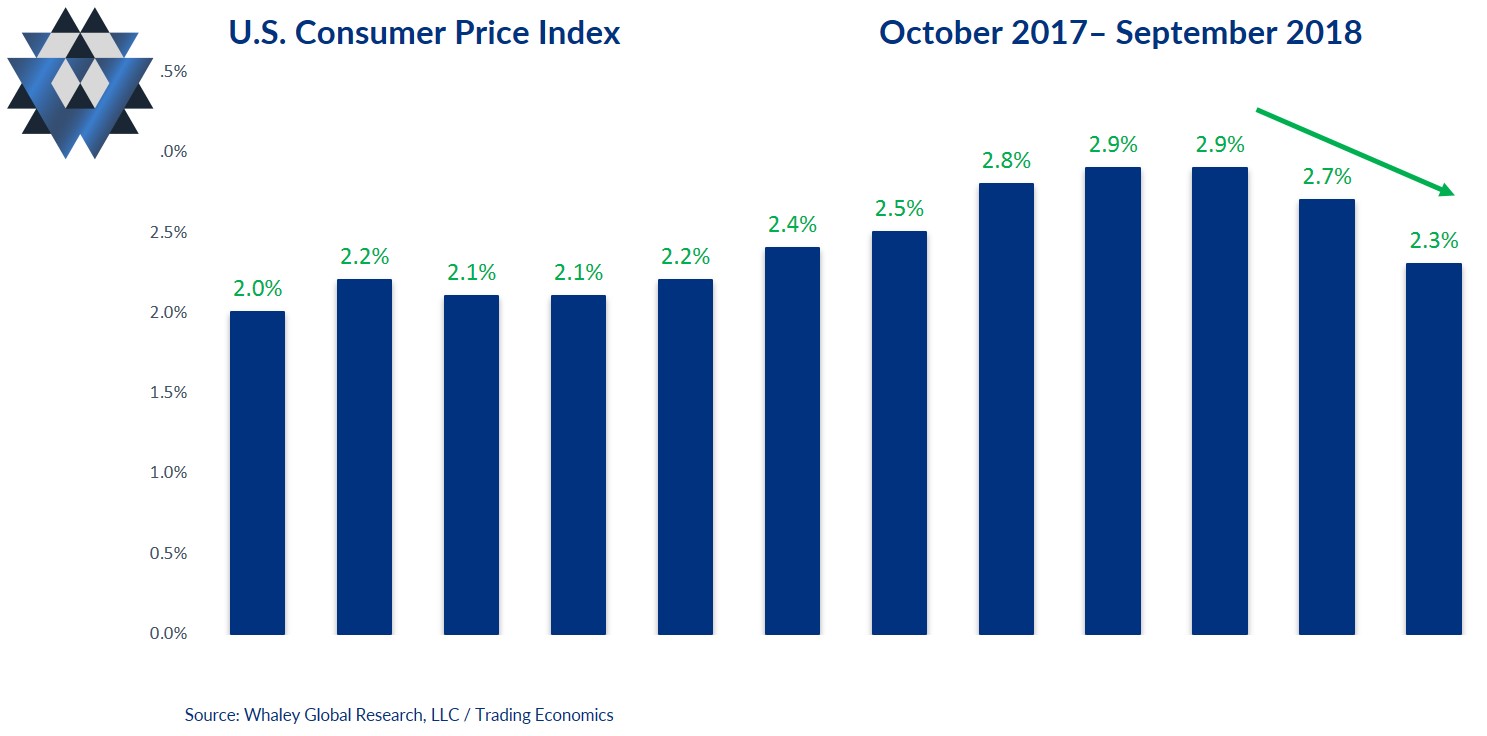
In the Gravitational Edge Playbook on July 16, we said, “Despite everyone’s belief that inflation is pulling a Superman and going up, up, and away, we believe inflation—along with growth—will begin to slow towards the end of 2018 and heading into 2019.”
Keep in mind we made this call just after receiving June’s inflation data, which marked the fifth consecutive monthly acceleration in consumer inflation. No recency bias for us!
Unlike what most economists, gurus and other market participants do, which is simply to extrapolate recent events forever into the future, we measure and map the slopes and extremes in economic and financial market data. Based on our own U.S. inflation models, back in July we saw an increasing likelihood that U.S. inflation was about to rollover and begin trending lower.
Since making that call, three months of inflation data has been released, and so far our call has proven correct. Consumer inflation flatlined in July from the June +2.9% reading and slowed in both August and September. Core inflation accelerated for one more month in July, slowed in August to +2.2% and flatlined at that same pace in September. Finally, June’s producer price index readings were in fact the peak, and PPI has now slowed in three of the last four months.
But it’s not just the “hard” inflation data confirming our July call; real time markets are telling us to double down on it now.
One of the purest ways to gauge the market’s expectations for future inflation is to analyze the spread between Treasury yields and TIPS yields. To that end, the five-year Breakeven Inflation Rate peaked on September 24 and the 10-year Breakeven Inflation Rate peaked on May 15, and both have been trending lower ever since.
The equity markets are singing the same lower-inflation song. The two most inflation-sensitive sectors of the U.S. equity market are metals & mining and energy stocks. The metals & mining sector peaked on June 7, has now declined -18.3% and experienced a maximum crashworthy drawdown during that time of -21.1%. In the same vein, energy stocks peaked on May 22 and have declined -10.8% while experiencing a -16.1% drawdown.
And finally, do you think crude oil’s -20.0% crash since October 3 may have some impact on inflation readings and expectations over the next few months?
The headline risk bottom line is that one of the hardest things for Wall Street (and most investors) to do is contextualize economic and financial market data. Hatzius, and anyone else in the inflation Superman camp, is about to find out that wage inflation and headline inflation can and will diverge.
At the beginning of the year, Goldman’s number one trade recommendation, which it re-confirmed in May, was to be long emerging market equities. Ouch! We profitably faded their call, nailing the crash across multiple EM equity markets. Once again, we find that our viewpoint is contrarian, and once again we are happy to fade the G-men and take the other side of the inflation trade.
Please click here and sign up if you’d like to receive the latest edition our research reports as well as to participate in a four-week free trial of our research offering, which consists of two weekly reports: Gravitational Edge and The Weekender.


