
The bond market is sending mixed signals, indicating contradictory risks that on the one hand, long-term interest rates may rise. On the other, the economy might soften. It isn’t clear which way things will go. Nearing 2019 caution is the watchword, says Dr. Marvin Appel.
Fortunately, there are two reasons for optimism in 2019. First, low-risk investments are paying more than at any time in the past 12 years. Second, current weakness in high yield bonds, an economic warning sign, is setting up an outstanding future buying opportunity. I will present the basis for this outlook in the sections below.
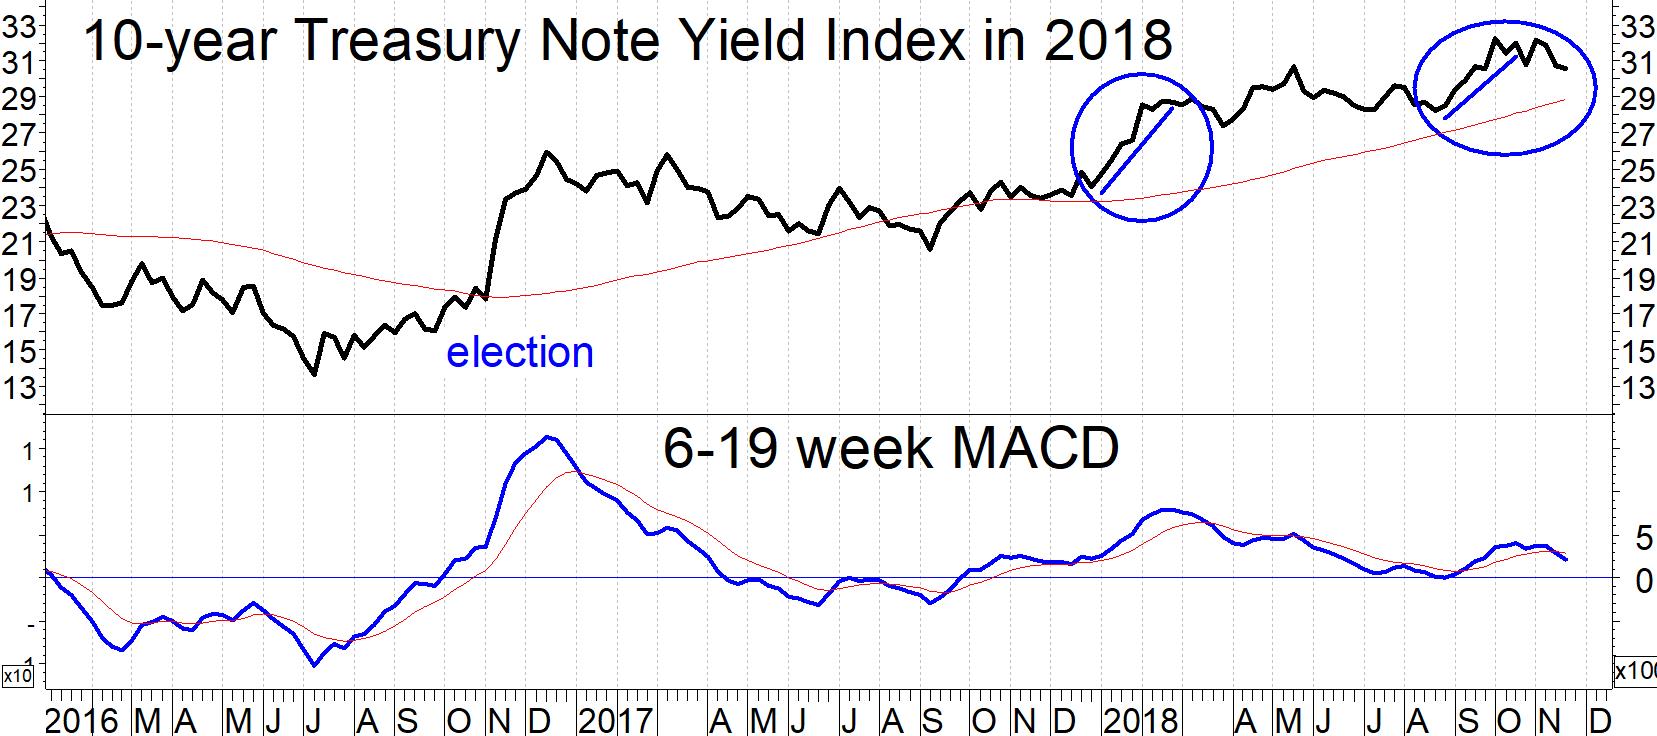
The trend in long-term Treasury yields is up
The chart below shows the uptrend in 10-year Treasury note yields since mid-2016. The clear visual uptrend is confirmed by the 6-19 week MACD being above zero, as has been the case for nearly 14 months.
Periods when the MACD indicator have been above zero have historically been associated with sideways rates during secular bond bull markets (1981-2016) and with rising rates during secular bond bear markets.
Why should yields be rising? For one thing, quantitative easing around the world artificially suppressed interest rates for years. The Fed is now slowly unwinding its balance sheet and the European Central Bank is scheduled to end quantitative easing in December.
Given nominal U.S. economic (GDP) growth of at least 4%, a normal 10-year yield would likewise be at least 4%. That doesn’t mean we will get there in 2019, although that is a possibility given the 0.8% (80 bp) jump in yields we saw in 2018. Either way, the pressure on 10-year yields should be up for the foreseeable future. Only a recession would push yields back down, and below we shall review two bond market indicators that should warn us when a recession is becoming more likely.
Watch the yield curve for a recession warning
Normally, longer-term interest rates are higher than short-term rates. The difference between a long-term yield and a short-term yield is called the slope of the yield curve. For example, one can look at 10-year Treasury note yields minus 2-year yields. The difference between them has ranged from -2% (2-year yields 2% above 10-year yields) to +3%.
On average historically, 10-year yields have been almost a full percentage point higher than 2-year yields. Currently, taking on the interest rate risk of holding a 10-year Treasury note gains you less than 0.3% more yield than the much safer 2-year note. During those infrequent periods when shorter term interest rates are higher than longer term rates the yield curve is said to be inverted.
Why should you watch this? Because every recession in the past 40 years (shaded in the chart) has been preceded by an inversion in the yield curve, as you can see in the chart below.
Sometimes the yield curve inversion occurs more than a year before the onset of the next recession, as in 2006. Sometimes the yield curve comes close to inverting, as in 1995, without a subsequent recession. The implication is that even though the yield curve is close to zero, the recession warning signal is not flashed until it actually goes negative.
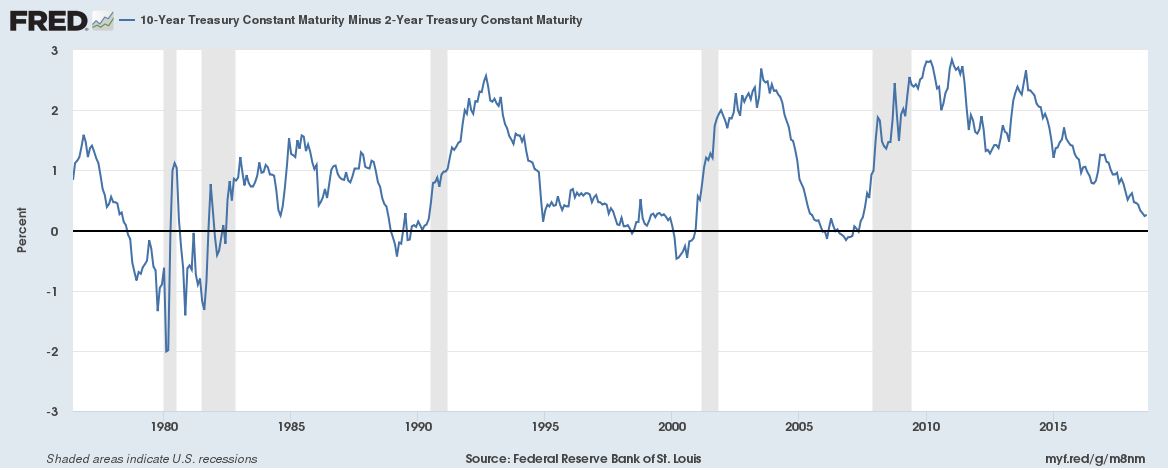
The reason why the yield curve has flattened so much in the past two years is that the Federal Reserve has been raising short-term interest rates faster than long-term rates have been climbing. This is a sign that the bond market expects the Fed’s rate hikes to gain traction in slowing inflation and economic growth.
Another economic warning sign may be coming from the high yield bond market. The chart below shows the difference (spread) between the yields on junk bonds and Treasuries. When this spread widens it means that the markets expect a worsening business climate. However, unlike yield curve inversions, not every spike in the high
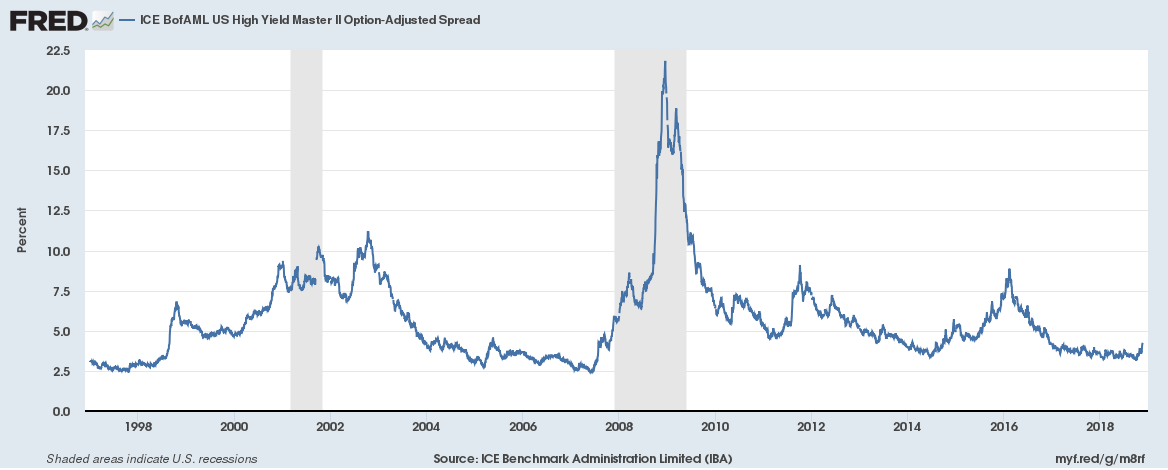
Yield bond spread has been followed by a recession. The current spread of 4.2% (circled) is towards the low end of the historical Range and below the average of 5.6%. Nonetheless, this is the highest spread since late 2016 and is a development that I take seriously. Previous spikes in the high yield bond spread such as 2011 and 2016 were associated with stock market corrections and economic uncertainty.
The proprietary high yield bond timing model that we use for our clients went on a sell signal in mid-October, and the newsletter high yield bond timing model is starting to generate sell signals. That means that the near-term outlook for high yield bonds is negative.
The good news is that with junk bond yields at relatively higher levels, we are setting up very favorable buying conditions for whenever the high yield bond market does turn up. I strongly recommend keeping an eye on high yield bonds and acting decisively on our next buy signals.
Implications
As we enter 2019, the perilous bond market climate warrants taking risk off the table. For our own clients, that has entailed selling high yield corporate bond funds. Our floating rate corporate bond fund models are also approaching sell signals, which we will follow when they arise.
Since the yields on longer-term and shorter-term investment-grade bonds are so close to each other (a flat yield curve), the most prudent course of action is to add exposure to short-term investment-grade bonds (Treasury bills or short-term bond funds) in order to minimize both credit and interest rate risk. If a recession does come our way, longer term Treasuries would be very profitable. But that is a gamble, as long-term rates appear at least as likely to rise as to fall.
The good news is that more than at any time in 12 years, investors are finally paid to wait in short-term investment grade bonds. Meanwhile, the increase in the spread between investment-grade and high yield bonds is setting up an attractive buying opportunity.
It may take several months before our models generate a fresh entry into high yield bond funds, but it should be worth the wait.
Sign up here for a free three-month subscription to Dr. Marvin Appel’s Systems and Forecasts newsletter, published every other week with hotline access to the most current commentary. No further obligation.
View a video interview with Marvin Appel and Dan Gramza on 2018 investing opportunities here.
Recorded: July 25, 2018 at TradersExpo Chicago.
Duration: 6:30.
View a video interview with Marvin Appel and John Bollinger on Bollinger Bands, when they are most useful for traders and about systematic investing pioneered by Dr. Appel and his father Gerald Appel here.
Recorded: July 25, 2018 at TradersExpo Chicago.
Duration: 4:31.


