
In the first installment of this series, I showed you the weekly seasonal composite chart of S&P futures. The chart supported the idea that stocks tend to rally from late October to late December, writes Jake Bernstein.
Indeed, this is a fairly long timeframe which may serve some traders well as a general expectation, However, in order to take advantage of this pattern we need to focus on more precise timing.
One way to achieve this purpose is to perform an iterative search on historical data which will give us clarity on what has happened in the past.
Obviously, no future is a precise carbon copy of the past. However, given sufficient historical data we can make reasonably solid projections about the future, provided patterns in the past have been reliable. To this end I have researched in finer detail the so-called Santa Claus rally in efforts to determine more precise entry and exit points as well as risks and average targets on the upside or downside.
The first step we will take is a big picture focus by looking at a larger timeframe. In the next episode of this three-part series I will go to finer detail showing shorter-term historical tendencies.
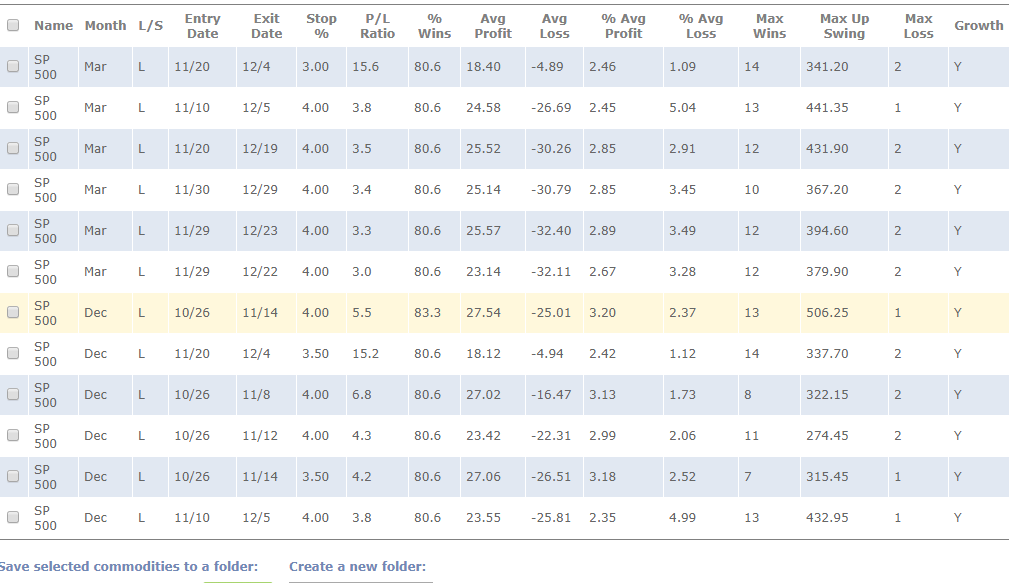
Let’s look at some data. Doing a broad search of possible entry and exit dates during the Santa Claus rally timeframe and searching for trades that historically would involve no more than 5% stop loss close only risk I get the following results.
It should be noted that these are in no way actual trades. Nor do they represent the future or a forecast or prediction; they only show what has happened in the past.
If you believe that the future is somehow related to the past, particularly with respect to seasonal patterns then the conclusions are obvious. (Search data provided by www.seasonaltrader.com)
Come back soon for part 3.
Best of trading!
Jake Bernstein


