
Headline risks are everywhere, much like profanity in an Eddie Murphy stand-up. As an investor you must keep your head on a swivel and human reactions in check so you’re not drawn into well-written narratives that promise to unveil the mystery of financial markets.
This week’s “Headline Risk” focusses on the U.S. yield curve and the narrative being spun about its inversion.
Last week, you could’ve played one hell of a drinking game that involved taking a shot every time you heard the phrase “inverted yield curve.” For the life of me I can’t figure out how the yield curve can be in “turmoil,” but I suppose CNBC noticed it makes good clickbait for unsuspecting investors. Let’s peel back the narrative and take a look at the data-dependent reality of the yield curve and what an inversion really means.
First, the spread that inverted was the 5-year Treasury yield minus the 3-year yield. I’ve been professionally managing money for almost two decades, and I have never, ever, heard anyone quote that spread before last week. I’ll be the first to admit that I’m not Captain Credit Market, but surely I would’ve heard of it before now if it was a meaningful indicator?
In fact, in contrast to the “5s minus 3s,” the most critical spread to monitor is the 10-year Treasury yield minus the 2-year yield, which has flattened this year but remains in positive territory—no inversion.
Second, the next thread of misinformation being tossed around about the inverted yield curve is what it means for a U.S. recession.
Every time the yield curve (10s minus 2s) inverts, we experience a recession, and everyone and their mother is predicting that an inversion is soon coming to a Treasury market near you.
What most people don’t understand is that it’s not inversion of the yield curve that one should pay attention to.
Instead, it’s the hockey stock in the YC that occurs after the inversion that matters most, which you can see in the graph below.
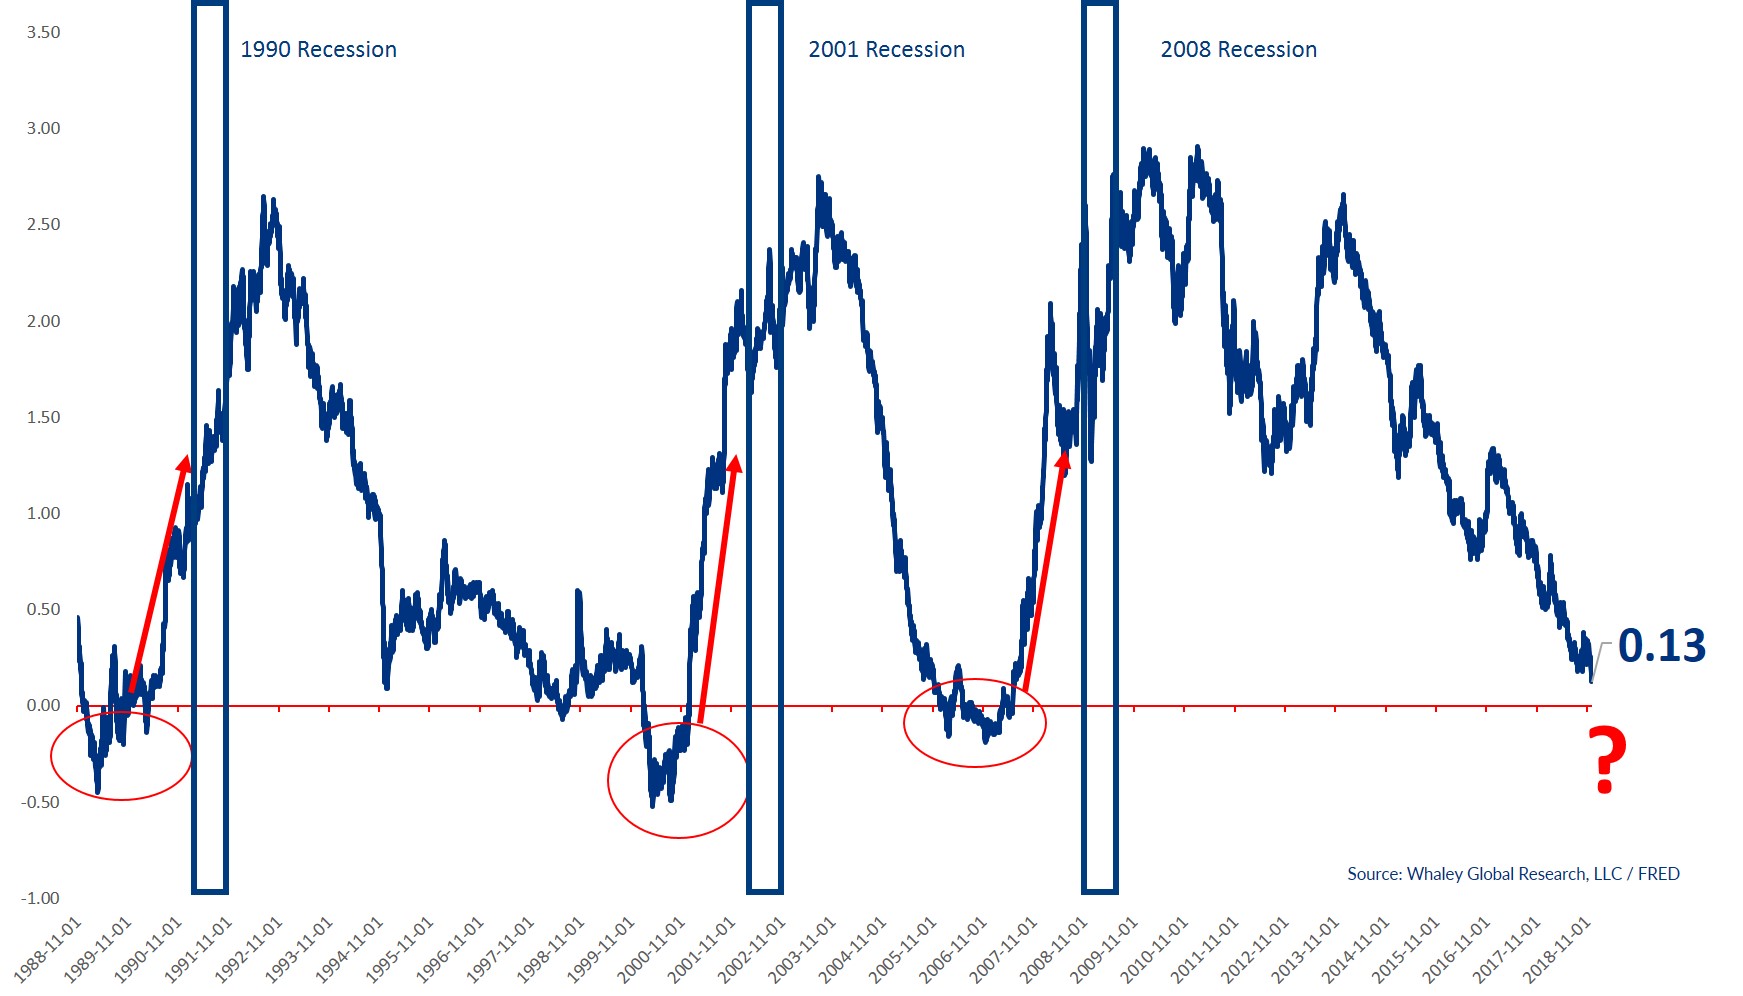
Even if the inversion is a harbinger of recessions, the average time from an inversion in the yield curve to a U.S. recession is longer than “Twin Peaks” was on the air. Since 1988, the yield curve has inverted for a meaningful duration on three separate occasions: December 1988, February 2000 and June 2006. After those three inversions it took an average of 780 days for a U.S. recession to appear.
So, point one is that even if the yield curve does invert, you’re going to have plenty of time to position your portfolio accordingly.
Point two, don’t let the media (or anyone else) scare you into believing that a yield curve inversion means it’s time to build a bunker loaded with canned food and ammo. Use the inversion to your advantage by being long one of the most hated markets on Earth right now, long-dated U.S. Treasuries.
The first inversion lasted six months from December 1988 to June 1989, and long-dated U.S. Treasuries gained +9.6%. The second inversion lasted 10 months from February 2000 to December 2000, and long-dated Treasuries gained +12.1%. The third inversion lasted 10 months from June 2006 to March 2007, and long-dated Treasuries gained +8.9%.
Not only are the returns more than palatable and equity-esque, but the average peak-to-trough drawdown experienced during these inversions was just -4.1%. With an average gain of +10.1%, the reward-to-risk ratio is more than 2-to-1 in favor of the upside.
Is that something you’d be interested in?
The Headline Risk bottom line is that we’ve been discussing for months the fact that the Fundamental Gravity in the U.S. is becoming more and more bullish for Treasuries.
An inverted yield curve would simply add accelerant to that bullish bonfire. Couple these realities with an uberly bearish Behavioral Gravity Index and you have all the makings of a terrific trade. Treasuries have busted a move to the upside this past week, but it’s just the beginning of a multi-month move upwards.
In fact, you can time stamp it, take a picture of it or Snapchat it (if you’re into that kind of thing). I’m doing my best Babe Ruth impersonation and calling the shot: long-dated Treasuries will be one of the best performing markets in the world over the next four months.
Reuters: Treasury yields rise as stocks rally Wednesday on U.S.-China trade optimism.
Please click here and sign up if you’d like to receive the latest edition our research reports as well as to participate in a four-week free trial of our research offering, which consists of three weekly reports: Gravitational Edge, The 358 and The Weekender.
Watch Landon Whaley’s 3 Ideas for Investing and the meaning of coddiwomple in a short video here.
Recorded: MoneyShow Dallas Oct. 5, 2018.
Duration: 6:42.
Watch Landon Whaley discuss When Markets Cycle in a short video here.
Landon Whaley: We have a generation of investors and asset managers who know only one market. The reality is markets and economies cycle and catch people off guard.
Recorded: MoneyShow Dallas Oct. 5, 2018.
Duration: 5:51.
Landon Whaley interviews Adrian Manz: How I approach stocks here.
Recorded: MoneyShow Dallas Oct. 5, 2018.
Duration: 7:48.
Landon Whaley interviews trader Jackie Ann Patterson: How I got started trading and how I approach it with my Truth about ETF Rotation here.
Recorded: MoneyShow Dallas Oct. 5, 2018.
Duration: 6:14.
Landon Whaley interviews John Carter: How I started trading here.
Recorded: MoneyShow Dallas Oct. 5, 2018.
Duration: 5:37.


