
Last week Paul Cretien highlighted how the yield curve inverted with an examination of Eurodollar Futures and Rates plus Treasury Yields. Here he shares how it can be exploited.
An inverted yield curved is universally seen as a sign of economic weakness and a precursor to a recession.
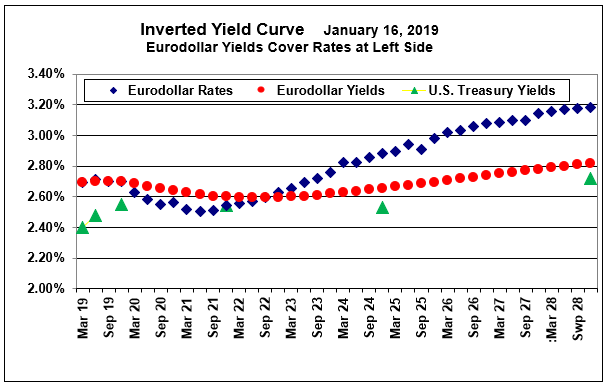
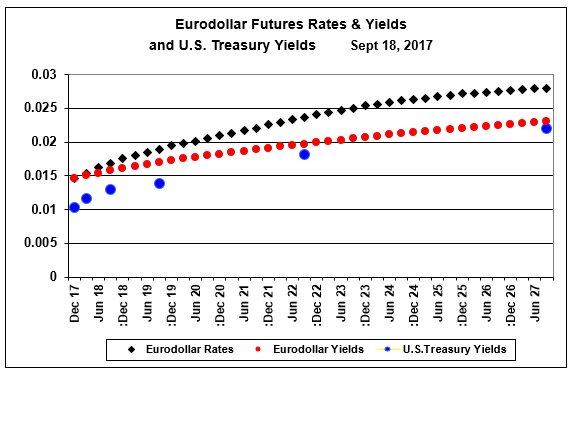
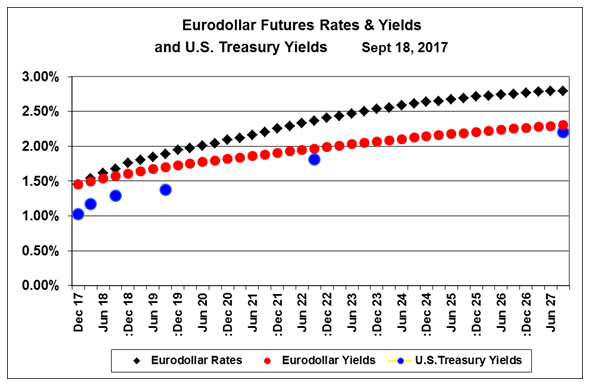
Typically analysts use the two-year/10-year interest rate spread, but there are fixed income durations from a few months to 30 years. The charts below show the U.S. Treasury yield curve with Eurodollar rates and yields on Sept. 18, 2017, and Jan.16, 2019. Probably the most important aspect of this illustration is that it shows the yield curve being inverted, with rates and yields declining rather than rising over a future period of approximately four years.
An inverted yield curve is generally caused by the Federal Reserve using higher short-term rates to cool off (that is, slow down) an overheated economy. Since the U.S. economy is currently positive, but not overheated with signs such as high inflation, the development of an inverted yield curve at this time is odd.
Some business enterprises will suffer from an inverted yield curve more than others. For example, banks depend on the spread between low cost rates on deposits and larger intermediate-term rates on bank loans for their basic income. An extended period of inverted yields will not be good for the banking business.
Within the past two weeks the Fed announced that it would be gradually raising short-term rates in 2019. In view of the inversion of rates it would seem that a better decision is a quick reduction in short-term rates through a repeat of the Fed’s providing liquidity by purchasing short-term securities.
Another recent idea floated by the Fed was a “smaller balance sheet,” that is, a reduction in its holding of securities purchased in massive quantities during the period of quantitative easing – a tool that helped the U.S. economy recover from the Great Recession.
Even during 2017, signs of a flattening of the yield curve were apparent. One stage of the flattening is shown on the lower chart. Part of the flattening was caused by the Fed’s infusing the nation’s economy with liquidity – especially with intermediate-term securities being purchased, which helped to drive down the longer-term versus short-term rates and yields.
A very shrewd or lucky investor in September, 2017, might have sold short a maturing Eurodollar futures contract — or bought a put on the Eurodollar futures — and captured at least a 12 basis point, $1,200 gain in less than a year and a half.
Now assuming that the Fed will need to take the opposite tack — inserting short-term liquidity — buying short-term Eurodollar futures now may be profitable before the end of 2019. As the rates go down the prices will rise.
It will be interesting to see how the Fed responds to the inverted yield curve and what actions it takes to cure this problem of its own making. Smart investors will be able to exploit this event.
An inverted yield curve is generally caused by the Federal Reserve using higher short-term rates to cool off (that is, slow down) an overheated economy. Since the U.S. economy is currently positive, but not overheated with signs such as high inflation, the development of an inverted yield curve at this time is odd.
Some business enterprises will suffer from an inverted yield curve more than others. For example, banks depend on the spread between low cost rates on deposits and larger intermediate-term rates on bank loans for their basic income. An extended period of inverted yields will not be good for the banking business.
We will present further analysis of this next week.


