
There’s a very infrequent situation taking place in the Treasury complex, reports Andy Waldock.
Commercial traders are negative feedback traders. They add to their positions as price moves against them. This gives them an average price that’s weighted near the market’s new top or, bottom. This is why they are short at the top, and long at the bottom. This is the exact opposite behavior of the large speculators. They are trend followers adding to winning positions. Therefore, the speculators’ position is more long at the top, and more short at the bottom. Now, we’re seeing the commercial traders buy Treasuries as the market moves higher.
The commercial 10-year Treasury note traders had neutralized their position by mid-March. Then, the commercial traders bought 300k during the April through June run-up in prices. The market spiked upwards, violently the last two times this situation occurred. We saw this from January through March of 2016 and further back, from September through October of 2014. Beyond these dates, we had to go back to December 2007 through March of 2008.
Typically, we only see this behavior at market tops and bottoms because the reversal drives prices back in line with the commercial trader net position. These are the peaks and troughs we’re trying to find. Treasury prices didn’t get the pullback the commercial traders were expecting. Perhaps it’s the recently dovish Federal Reserve Board. Either way, the commercial traders have been merely re-purchasing their short contracts. This short covering has brought their net position back to neutral. Continued buying could quickly spur new highs in prices/(lows in yield) in the September contract.
Canadian Dollar
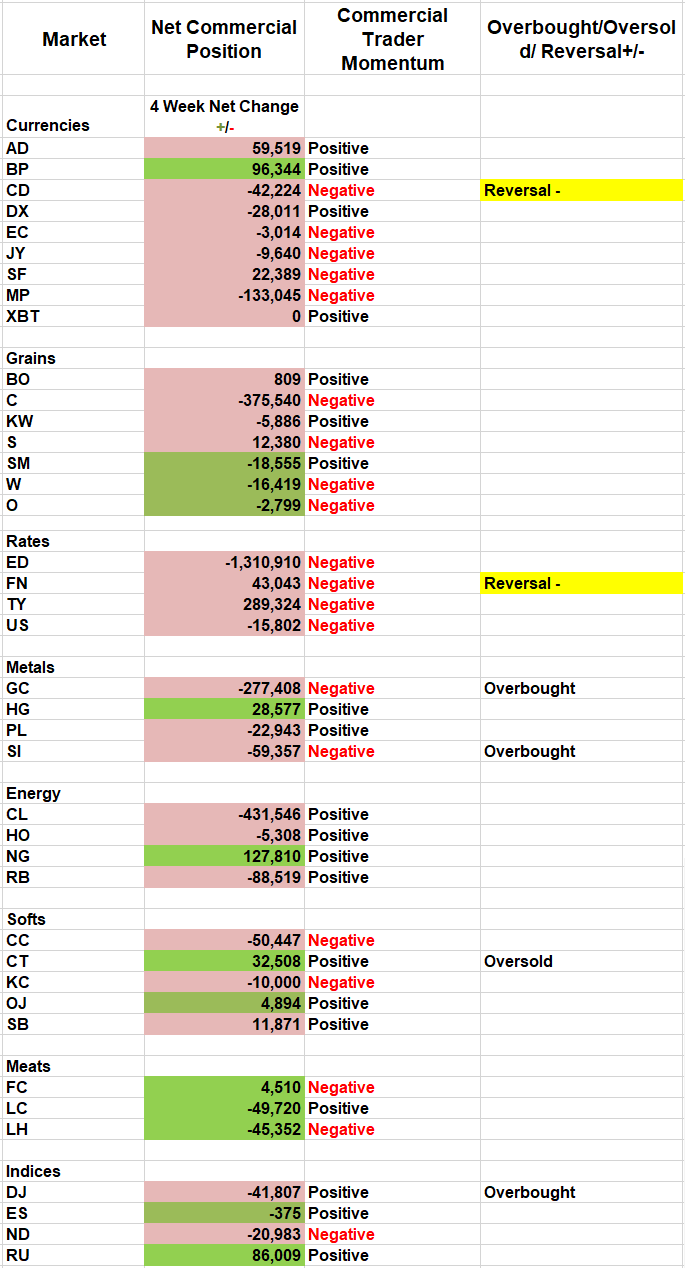
The current setup in the Canadian dollar is an excellent example of basic technical analysis working in conjunction with the COT report. The Canadian dollar’s rally has stalled near two resistance points, and the commercial traders have been massive sellers against it.
The loonie is currently abutting a weekly trend line dating back to September of 2012 and the 90- and 120-week moving averages. For posterity’s sake, the 90-week moving average is .7728, and the 120-week is .7757. The weekly trend line comes in at .7750 for next week’s trading.
Furthermore, the commercial traders’ net position has declined by more than 85k contracts since June 7. This is also a new 52-week net low for the commercial position. Their recent selling pressure is now more than two standard deviations below their average. The last time this happened was May 2016. This was also the last time the Canadian dollar traded above 80¢ to the greenback.
Those with a long-term perspective should look for short-selling opportunities, while not risking it above .7775.
Corn
Commercial corn suppliers continue to sell at a breakneck pace. Their net short position continued to grow last week and is now the largest the corn market has seen since June of 2011. Strategically, there are two competing scenarios. One, December corn’s high at$4.73 becomes the high for the foreseeable or, we get one more speculative push upwards. If so, I still have a hard time believing December corn is going to settle above $5 per bushel. Again, this looks a lot more like a rally to be sold than a breakout to be bought and followed.
Open Positions
Leave the Canadian dollar, copper, and cocoa stops should remain at their current levels.
Andy is presenting at the TradersEXPO Chicago on July 23. Here is what Andy had to say about seasonality and the COT Report at the recent TradersEXPO New York.
Visit Andy Waldock Trading to learn more. Register and see our daily and weekly signals archive for entries and stop loss levels sent to our subscribers.


