
The E-mini has a nested double top, but a minor reversal to below the 2940 ledge top is more likely than a bear trend, writes Al Brooks.
The monthly S&P 500 E-mini futures chart has a bull trend bar so far in September. Since June formed consecutive outside bars “OO” bullish pattern, I have been saying that the E-mini would be sideways to up into at least September. July went above the June high and triggered the “OO” buy signal. A rally from an “OO” pattern usually continues sideways to up for at least three months.
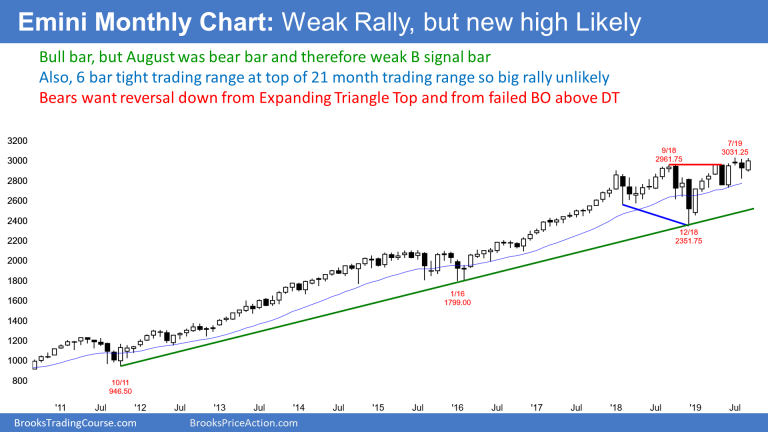
Can it last longer? Three months is the minimum. But think about the pattern. Consecutive inside bars (an ii pattern) is a triangle on a smaller time frame chart. A triangle has at least five legs. That means that the market is spending a lot of time oscillating around a price. Traders see that price as important. It is a magnet. A breakout above or below usually reverses back to the triangle within about 10 bars.
It is important to note that an ii pattern is a traditional triangle, which means one that is constricting. An “OO” pattern is usually an expanding triangle on a smaller time frame chart. It, too, has at least five legs on a smaller time frame, and it oscillates around its middle. Again, that middle is a magnet.
Therefore, once there is a breakout up or down, there is a force that tends to draw the market back to that price within about 10 bars. This will probably limit the near-term extent of the breakout above the 21-month trading range. It could certainly continue for a few more bars, but the middle of the triangle will probably pull any rally back to the 3,000 middle of the triangle.
Weak High 1 bull flag buy signal bar
August was a pullback in a bull trend. It was therefore a High 1 bull flag buy signal bar. But it had a bear body. That lowers the probability of a big rally over the next few bars. In fact, there are often more sellers than buyers above a bear buy signal bar.
This is especially true when the buy signal is not in a strong bull trend. This one is at the top of a 21-month trading range. Traders should expect the September rally to lead to a pullback in October or November.
21-month expanding triangle top
I have mentioned many times over the past several months that there is a big expanding triangle top on the weekly and monthly charts. The sell signal triggered when August traded below July.
But July was a doji bar and that is a low probability sell signal bar. Furthermore, July just triggered an “OO” buy signal. Traders were going to buy below the weak sell signal bar, expecting sideways to up over the next couple months.
What happens if October is a bear reversal bar? It would then be a second sell signal for the 21-month expanding triangle. A second sell signal has a higher probability of leading to at least a minor reversal. This is especially true if the sell signal bar is strong in October or November. That means a relatively big bear body and a close near the low of the bar.
If the bears get that, traders would look for a test down to at least the most recent higher low. That is the August low just above 2800.
A reversal down from a major top usually has at least two legs. If the reversal down is strong, traders would then look for a test down to the next support, which is the June low around 2700.
The E-mini S&P 500 futures had a bear doji bar last week on the weekly chart (see below). This is slightly bearish compared to last’s small bull body. And last week’s body was smaller than that of the week before, which means less bullish. This is a loss of momentum over the past three weeks. It is not what the bulls want to see as they try to break out to a new all-time high.
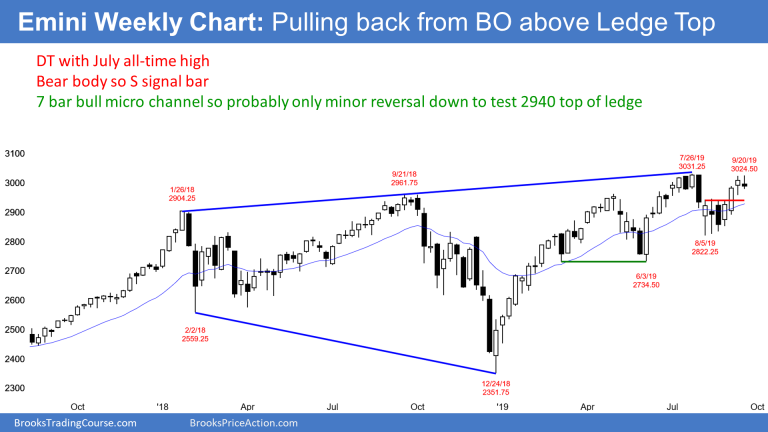
This hesitation near the prior high, makes traders wonder if this rally is simply a test of the prior high. A lack of momentum means a lack of buyers. The bulls are hesitating to buy at this price. If there is a strong break above the July high, many would be willing to buy higher.
Alternatively, if there is a reversal down to support, like at the top of the August ledge at 2940, many bulls will buy. Traders are now deciding if there will be a strong bull breakout or a pullback.
Breakouts & Pullbacks
There were four consecutive weeks in August with essentially identical highs. That is a ledge top. It is support and therefore a magnet. Once the ledge formed, there was a high probability of a breakout above the ledge.
There also would be a high probability of a pullback below the top of the ledge before the rally went very far. That is still likely to happen. But traders do not know if it will happen from where the E-mini currently is or from a new all-time high. This week’s bear body makes a test of the ledge top slightly more likely within a couple weeks.
If the E-mini turns strongly down from here, there would be a double top with the July all-time high. If instead it breaks to a new high and then reverses, there would be a wedge top with the May and July highs.
But any reversal will more likely lead to a trading range or a bull flag than a bear trend. Traders should expect a new high within the next several weeks. There is currently only a 30% chance that this week’s reversal down will test below 2800 before there is a new high.
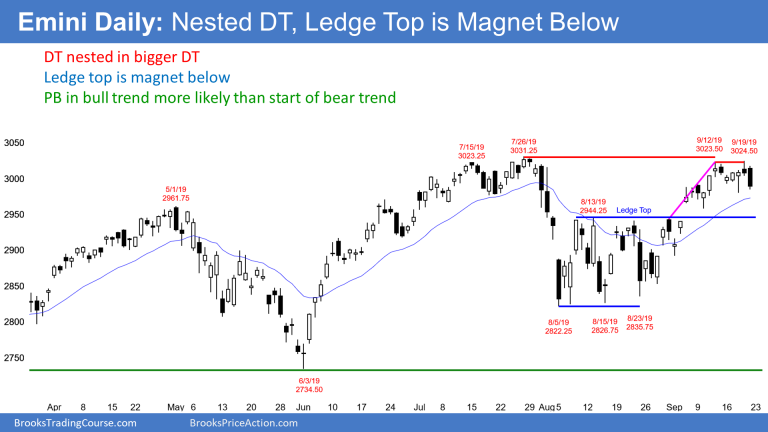
The E-mini S&P 500 futures triggered a sell signal on Friday on the daily chart by trading below Thursday’s low. Thursday was a sell signal bar for a double top with last week’s high. Furthermore, the two-week double top is nested within a larger double top with the July all-time high.
The bears want a break below Wednesday’s low. That is the neckline of the two-week double top. A measured move down would be near the August ledge top at 2940. A ledge top is a reliable magnet. Therefore, the E-mini will probably dip below that top within a few weeks. The bulls will see the test down as forming a bull flag. However, the bears want that pullback to grow into a bear trend.
Without a strong reversal down over the next couple weeks, a pullback followed by higher prices is more likely. I have been saying since June that a new all-time high was likely to come in September or October. That is still true.
However, the E-mini went sideways for four weeks in July. It is now in that trading range. That increases the chance of more sideways to down trading over the next couple of weeks.
Trading Room
Traders can see the end of the day bar-by-bar price action report by signing up for free at BrooksPriceAction.com. I talk about the detailed E-mini price action real-time throughout the day in the BrooksPriceAction.com trading room. We offer a two-day free trial.


