

Frank Kollar of Fibtimer.com sees a bullish pattern emerging for a stock that crossed below its 200-day moving average on Tuesday.
Shares of Adobe Systems (ADBE) are tracing out a potentially bullish pattern on their weekly chart.
Looking at the weekly chart (below) you can see that Adobe has three short-term corrections since reaching its long-term correction low in May 2012. Each of these lows has reached a higher low before reversing to the upside.
Since March 2012, Adobe has reached the $34.00 level three times and shortly after, reversed and corrected.
This points to $34.00 as a strong resistance level and the rising green support line in the below chart as a support level.
The pattern is called a bullish pennant formation. Typically, pennant patterns break in the direction of the previous trend, which in this case was a bullish one from April 2011 to March 2012.
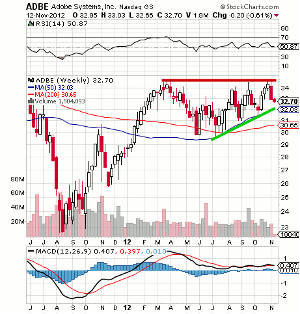
Chart Courtesy of StockCharts.com
Click to Enlarge
Adobe has corrected for the past two weeks after again reaching that $34.00 resistance level. Adobe is closing in on that rising trend support line.
A strong reversal pattern at about $32.00 a share, or for more conservative traders a break and close above $34.50 a share, would be good places for a bullish entry.
Frank Kollar, editor of Fibtimer.com, does not currently have a position in Adobe Systems.


