This stock tends to travel in semi-chaotic, yet powerful thrusts, that can be difficult to trade with a long-term trend following method, notes Donald Pendergast of SentientTrader.com, but it could offer endless trading opportunities.
Although it took shares of Baker Hughes (BHI) nearly seven weeks to finally hammer out an identifiable double bottom pattern late last year, for bullish traders and investors the wait proved very worthwhile, with BHI soaring higher for much of January 2013. With the stock in the early stages of forming a large-scale triangle pattern—suggesting the possibility of strong moves in either direction once it completes—now might be a good time to size up the current price cycle and money flow trends in this key oil services group stock.
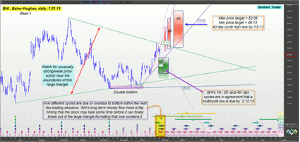
Watch for the upper portion of the green cycle low time/price projection zone to see if it offers meaningful support.
BHI, like many of its large-cap brethren in the energy sector, tends to travel in semi-chaotic yet powerful thrusts that can be difficult to trade with a long-term trend following method, but for those who can be happy with swing moves lasting four to seven days, BHI appears to be a stock offering a near endless supply of trading opportunities. The use of price cycle analysis can be of benefit to such traders, particularly when high probability cycle high/low turning points can be identified—sometimes well in advance of the actual reversal; in BHI's case, its 10-, 20-, and 40-day cycles are all in strong agreement that a multi-cycle low is due (green boxes on chart) by no later than February 12, 2013, and that the maximum decline into the low should be around the 41.89 area. Note that the stock's latest swing high is actually one of the upper anchor points for the triangle pattern; there are plenty of other traders aware of this too, and the odds are high that BHI will continue to drift lower into some part of the green time/price projection zone before attempting to stage another rebound and possible touch of the upper triangle boundary.
NEXT PAGE: The Strategy |pagebreak|
If and when the stock can clear the upper boundary of the triangle, the red boxes indicate several possible time/price projection targets for BHI between now and March 6, 2013. The 40-day cycle high price range and latest expected completion date for a peak is shown on the chart. For what it's worth, given the size of the rally needed to reach the upper price ranges of all the red projected cycle high zones, it would seem logical that BHI's current pullback would need to terminate in the upper green zone in order to be able to cover the distance needed to hit the lower $50 area by early March 2013; for now, your best opportunity is still to play the current decline in hopes of a run lower toward the lower 43.00-43.25 area.
Long-term money flow in BHI is flat (not shown), with no strong trend bias at all, which is consistent with a range bound, swing trader's market, and at this moment, one of the better ways to play BHI might be to buy put options on a decline below Thursday's low of 44.48, using an initial price target of 43.00 to 43.25, which happens to be the general price area of the uptrend line directly below the most recent price bar. This trend line also intersects with the upper range of the time/price cycle projection zone and would be a very logical place to take full or even partial profits if a meaningful decline ensues from here.
BHI has been performing very poorly over the past 52 weeks—both against its oil services group peers and the S&P 500 index.
Some interesting put option strikes include the April '13 BHI $44.00, $45.00 and $46.00; all have exceptional open interest (between 777 and 2,900 contracts each, tight bid-ask spreads and modest time decay of only $1 per day/per contract). If you do decide to sell any one of these puts, be sure to book a profit if any one of them increases in value by 80% OR if the aforementioned trend line target area is reached. Conversely, if Thursday's high of 45.07 is reached OR if the option loses 50% of its value, just sell it for a loss, making sure you never risk more than 2% of your account equity on this or any other stock or stock option trade.
Donald Pendergast can be found at SentientTrader.com.


