Will it happen next week? Rare things are rare because they rarely happen. To bet that a rare thing will happen is a low probability bet. Therefore, the odds of a crash anytime soon are tiny, despite the current buy climaxes, asserts Al Brooks.
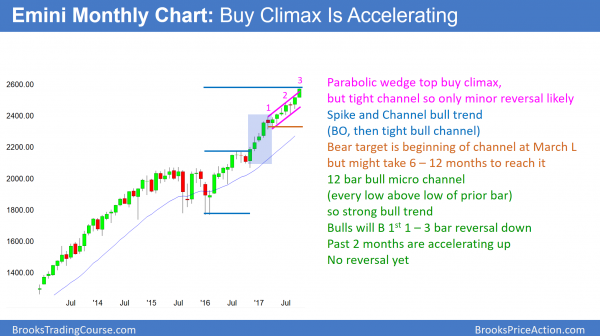
Monthly S&P500 Emini futures candlestick chart:
Protracted buy climax
Every bar for the past 11 months has a low above the low of the prior month on the monthly S&P500 Emini futures candlestick chart. This is, therefore, a 12 bar bull micro channel. Although this means the bull trend is strong, it is also a buy climax. The past 2 months are accelerating upward. While it could be a measuring gap, it will more likely be the start of a blow-off top.
The monthly S&P500 Emini futures candlestick chart is in 12 bar bull micro channel. The only time in the past 50 years when the monthly S&P500 cash index had a longer bull micro channel was in 1995. That micro channel lasted 13 months. The pullback lasted only one month, and it was about 4%. The bull trend then continued up 4 fold over the next 5 years.
While the current rally will almost certainly not quadruple over the next 5 years, the pullback will probably be comparable to the one in 1995. Therefore, the odds favor about a 5% pullback before the current micro channel lasts much longer.
Theoretically, there does not ever have to be a pullback. However, that is not how markets behave. Since it is now showing extreme behavior, it is likely to do what it has always done before it becomes much more extreme.
The odds, therefore, favor a 1 – 3 month pullback beginning within the next few months. Since the bull trend is so strong, the bulls will buy the pullback. This is true even if it lasts a year and falls 20% from the high. The bears would need a reversal at least that big before traders would begin to conclude that the bull trend had ended.
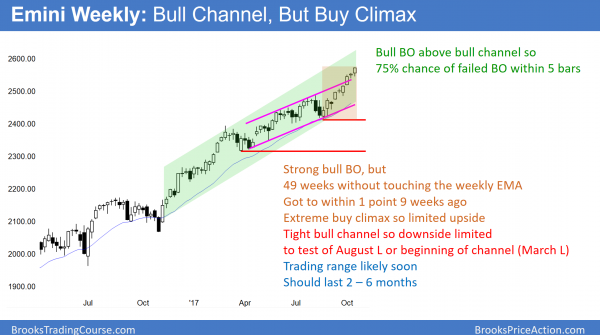
Weekly S&P500 Emini futures candlestick chart:
Continuing buy climax
The weekly S&P500 Emini futures candlestick chart has not touched the 20-week exponential moving average in 49 weeks. This is a very strong bull trend, but overbought.
Get Trading Insights, MoneyShow’s free trading newsletter »
The weekly S&P500 Emini futures candlestick chart has been above its 20-week moving average for 49 weeks. This has never happened in the 18 years of the Emini. In 2003, it stayed above for 48 weeks and finally touched on the average on the 49th week. It then entered a trading range for the next 10 months. Furthermore, the bottom of that range was 10% below the high.
Although the weekly chart can stay above its average price indefinitely, the basis of technical analysis is that the charts are a reflection of rational human behavior. Since the current behavior has to be rational, it is unlikely to deviate from past behavior for too long. Consequently, the odds are that the Emini will soon begin to go sideways to down to its average. To get there quickly, it would have to fall at least 80 points.
More likely, once it begins to pull back, it will take several weeks to get there. That would require only about a 50 point drop from the high. However, it will probably fall at least 20 – 50 points below the average after being so far above it for so long. That means that the pullback will probably be 100 – 150 points. However, there is no top yet, and until there is a strong reversal down, the odds favor higher prices.
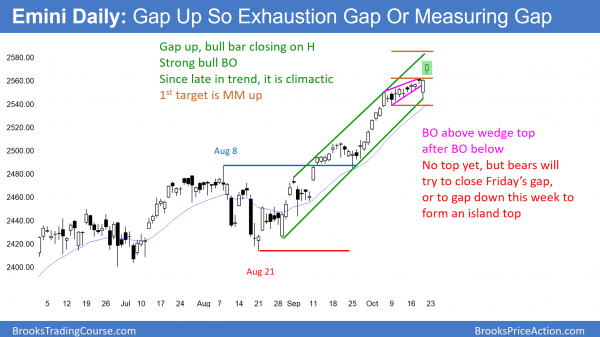
Daily S&P500 Emini futures candlestick chart:
Buy climax at 30th anniversary of 1987 stock market crash
The daily S&P500 Emini futures candlestick chart was in a wedge bull channel for 2 weeks. After breaking below it on Thursday, it reversed up. It then gapped up to a new all-time high on Friday. The next target is a measured move up, based on the height of the wedge.
The daily S&P500 Emini futures candlestick chart broke below a small wedge top on Thursday but immediately reversed back up. It gapped up to a new all-time high on Friday. The bulls want strong follow-through buying and at least a measured move up, based on the height of the wedge.
The bears want the rally to a new high to fail, and then they want a break below Thursday’s low. That low is a major higher low because it led to a strong reversal up to a new high. A break below would convert the bull trend into either a trading range or possibly a bear trend.
When there is a gap up, the Emini often goes sideways for a few days. The bulls see the small range as a bull flag, but the bears see it as a potential island top. Because Friday closed on its high, it will probably go at least a little higher before there is a 2 – 5-day pause. Then, the Emini will again decide between a reversal down or higher prices. Since most tops fail, the odds always favor higher prices. Yet, because the buy climaxes are so extreme on the weekly and monthly charts, the odds of a reversal are increasing.
Blow-off top?
Because of the extreme buy climaxes on the weekly and monthly charts, there is an increased risk of a blow-off top. By this I mean a very strong, brief rally that reverses down violently. This rarely happens, but when it does, it usually comes when the Emini is already in a buy climax, like now.
Whenever there is an extreme buy climax, there is always an increased chance of one or more big bear days coming at any time. If that happens, it can be the start of a correction that can last 20 or more bars. Since the buy climaxes on the weekly and monthly charts are extreme, when there is a correction, the Emini might go sideways for many months. However, until there is a strong reversal down, the odds are that the buy climax will continue to get more climactic.
Gap up in buy climax so possible island top
Whenever there is a gap up to a new high, there is a buy climax on the daily chart. That means that there is an increased chance of a reversal down. This is especially true because the weekly and monthly charts are also in buy climaxes.
If the Emini gaps down within the next couple of weeks, that gap down would create an island top with Friday’s gap up. This would slightly increase the odds of a correction, but most tops fail. Therefore, the odds are that an island top would lead to a minor reversal. However, the Emini has never been this overbought in its 18-year history.
In addition, the S&P cash index has only been this extreme once in the past 50 years. Hence, there is an increased chance of a 100 point, 5% correction beginning in the next few weeks. Yet, until there is a strong reversal down, the odds continue to favor higher prices.
Instead of gapping down, sometimes the Emini trades down and closes the gap. This would happen if the Emini fell back below Thursday’s high. That gap then becomes an exhaustion gap. It has the same significance as an island top.
30 years after the 1987 stock market crash
I remember being heavily short that morning 30 years ago. I sold 13 full-size (there were no “minis” back then) S&P futures contracts early that day, which is the equivalent of 65 Emini contracts today. Yes, the price was much less, but it was still a good position, given how volatile the market was and how I was a new trader. Since I had a full surgery schedule that day, I had to close out my position early so that I could go to the operating room.
As I was driving to work, I listened to the radio and heard that the stock market was collapsing, but all of the stations said that it was impossible to know how far down it was.
The technology could not keep up. There were no bids. No one was buying, and that made it impossible to go short once the selling began.
Anyone who bought was stuck with their position for the entire day. Remember, someone has to buy from you for you to go short, and there were zero buyers. None.<
At the end of the day, the Dow was down 22% and I think the S&P fell 26%. It was the biggest one day crash in history. In fact, it was even bigger than the 1929 crash, although that one continued down for a few years and the Dow ultimately lost about 90%.
Would a beginner manage his trade well during a crash?
Had I been able to stay home, and had I held until the close, I would have made $400,000 that day. That would be about a million dollars in today’s money.
Even if I made that money, I was a beginner back then. I therefore probably would have given a lot of it back over the next few weeks because there were several extreme reversals. I probably would have bought high and sold low, and lost money. However, it is fun to think back to that time.
Will it happen next week? Rare things are rare because they rarely happen. To bet that a rare thing will happen is a low probability bet. Therefore, the odds of a crash anytime soon are tiny, despite the current buy climaxes.


