
Stick to strong sectors while using smaller position sizes and using options, especially income generating strategies such as covered calls and spreads. Traders who manage risk appropriately will make it to the fall with more money in their pockets, writes Joe Duarte.
Given the general state of the world, the old adage “sell in May and go away” may or may not be the way to go this year. Moreover, the key to price movement may have more to do with news headlines and how robot traders respond than to internal market events.
There is a certain feeling in the air that something meaningful is about to happen and given the Trump administration’s penchant for unpredictability and showmanship it should not be a surprise if something that they do moves the markets in a big way.
I certainly don’t want a political discussion here, but generally speaking from a market perspective, it’s best to acknowledge the presence of political influences while focusing on how the market responds to them. In that vein there are several major issues which could deliver surprises and lead to big price moves. One is the China trade situation, where it seems as if both sides may have reached a truce of some sort. If the robots react as they normally do to this type of thing, we may witness a significant price rip to the upside in the short term.
Other external trends to watch are the situation with Iran, and the possibility that Europe decides to fully side with Iran and not the U.S. on the nuclear deal and the fallout from Trump's pulling out of the arrangement. In this case we may see further volatility in the currency and oil markets.
Finally, there is the wildcard known as the Mueller investigation which is impossible to handicap and could be full of unexpected twists and turns over the next few weeks.
With that background in mind, let’s fully circle back to the markets where last week ending May 18 was for lack of a better word, pretty lame - with the big news being the new all-time high by the Russell 2000 (RUT) index of small stocks.
The bright side is that at least one major index confirmed the new high in the New York Stock Exchange Advance Decline line. Even though it’s not as impressive as the S&P 500 (SPX) or the NASDAQ delivering a new high to confirm the advance decline line, a new high by the Russell 200 is better than no new high at all. The flip side is that traditionally, small stocks tend to outperform large cap stocks near the end of bull markets. Of course, since the markets, to some degree, presently function differently than in the past due to the presence of robot algorithms and their programs it’s difficult to gauge what the new high in the small stocks may mean, beyond the fact that it happened.
A small stock rally is better than no rally
The New York Stock Exchange Advance Decline line (NYAD), the most accurate indicator of the stock market’s trend since the November 16 U.S. presidential election made a new high last week which was confirmed by, of all things, a new high in the Russell 2000 Index of small stocks.
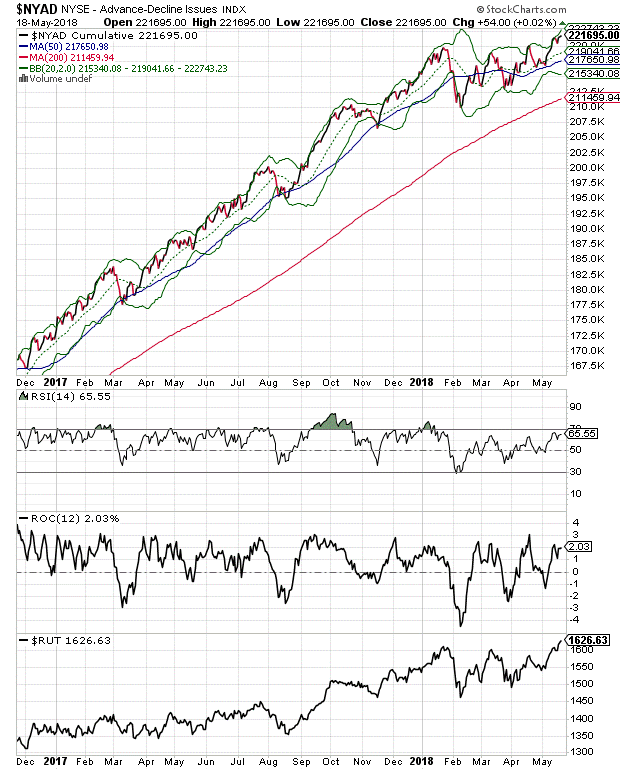
There are three key points on the NYAD chart to note:
1) The RSI for NYAD is still below the overbought line.
2) ROC still has room to rise.
3) Note the new high in RUT –bottom panel- making new high.
The bottom line here is that the market’s trend remains up and that we are not overbought, yet, which means stocks can still move higher in the short to intermediate term if the algos like what they read in the headlines.
Large stocks took the week off
While the small stocks moved decidedly higher last week, the large stocks stalled slightly. And while that may all change in the next few days, this is what we had at the close of business on May 18.
Certainly, that was a bit of a negative when seen as a snapshot of one day’s trading. But since that’s history and new headlines will develop, it makes more sense to watch the charts than to make big bets on what we saw last week.
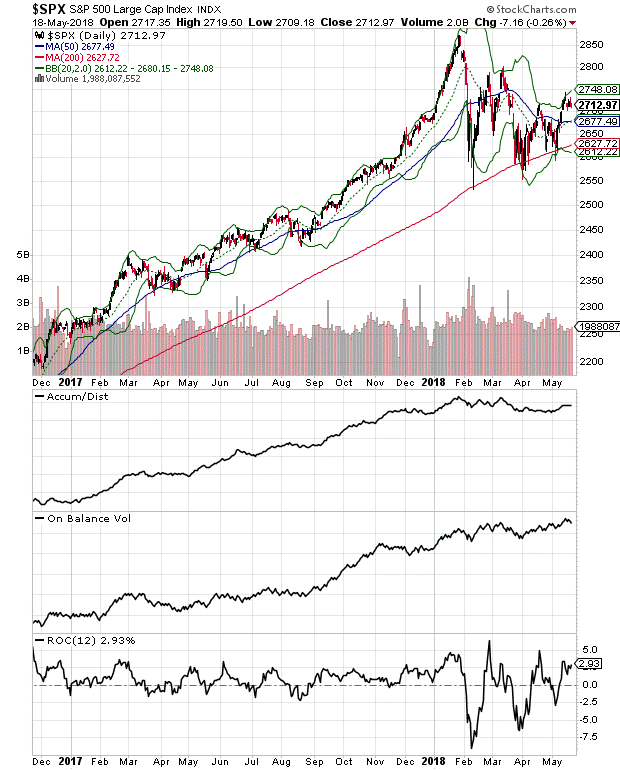
Nevertheless, it’s good to explore the details. Indeed, the S&P 500 (SPX) and the Nasdaq 100 (NDX) indexes both showed slightly negative Accumulation Distribution (ADI) and On Balance Volume (OBV), both signs that money was starting to move out from the index components. This was confirmed by rising volume bars when the market fell on Friday.
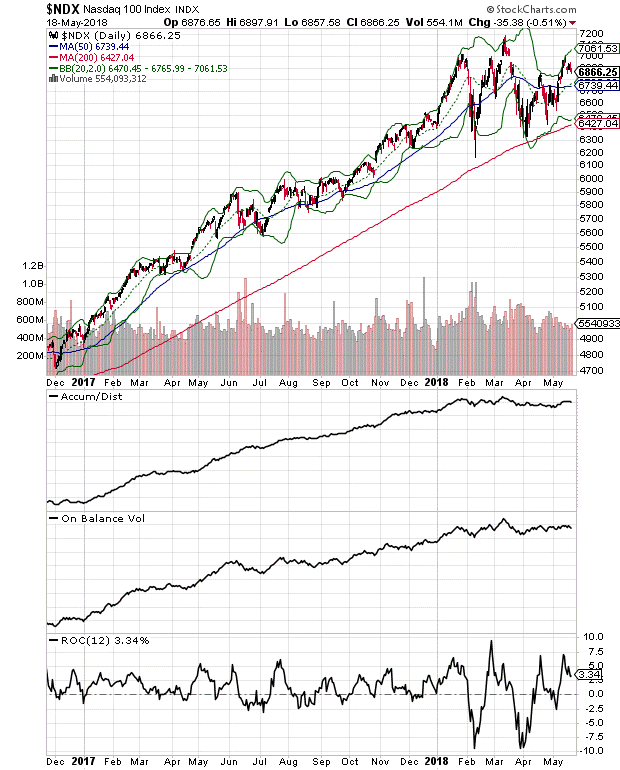
So, the key here is to see what the entire market does as the news flow develops in the next few days. If the majority of the market picks up the trend blazed by the small stocks, we may get at least one or two more weeks to the up side. And 2800 on SPX is still an important chart resistance point to monitor.
It’s a news-driven market
Summer markets are traditionally thinner than other market periods. That’s because traders go to the beach. As a result, under normal circumstances during the summer months, news headlines often influence prices more dramatically than when more trading desks are manned.
Furthermore, when you add the influence of robot trading algos to the mix, there is the potential for even more pronounced price movement in response to headlines.
Successful trading is more about the return of your money than the return on your money.
Joe Duarte is author of Trading Options for Dummies, now in its third edition. He writes about options and stocks at www.joeduarteinthemoneyoptions.com.


