
The bulls need follow-through buying this week. Since the rally from the May low was strong, the odds favor at least slightly higher prices this week. The bears see Friday as a second entry short for a failed breakout above the April 18 lower high, writes Al Brooks.
Monthly S&P500 Emini futures candlestick chart:
Weak buy signal
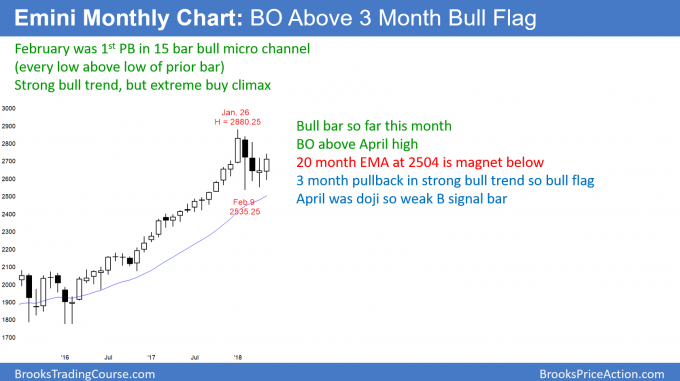
The monthly S&P 500 Emini futures candlestick chart traded above the April high. This triggered a buy signal. However, April was a doji bar and therefore a weak signal bar. So far, May is a bull bar, but it is currently only at the April high and not far above.
The monthly S&P 500 Emini futures candlestick chart has a four-month bull flag. Since May broke above last month’s high, the bulls hope that the bull trend is resuming. Yet, each candle stick for the past three months has had prominent tails. This is a tight trading range and a magnet. It resists breakouts. Therefore, the bulls need May to close on its high, and preferably far above the April high. In addition, they need June to be a bull trend bar as well. Otherwise, the odds favor more sideways bars in the four-month tight trading range.
The bulls had a 15-month bull micro channel that ended when February traded below the January low. After such a strong bull trend, there is only a 20% chance of a bear trend on the monthly chart without at least a small double top. Therefore, the downside risk is probably limited to a 5 – 10 bar pullback and maybe a tested below the 20-month EMA. If the Emini pulls back to the EMA, it will likely fall at least 30 – 50 points below. That means that a break below the February low would probably continue down to at least 2450.
Weekly S&P 500 Emini futures candlestick chart:
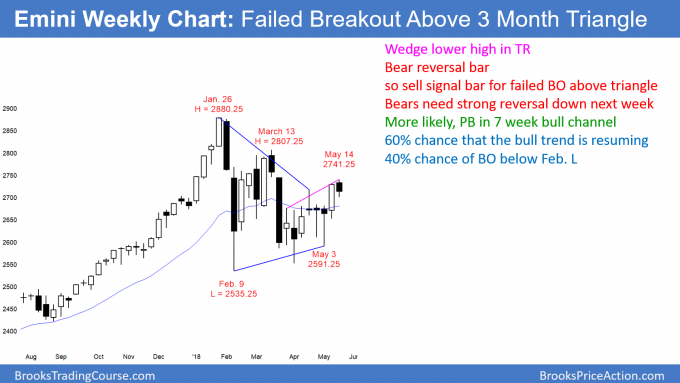
Bar follow-through after breakout above a triangle two weeks ago
The weekly S&P 500 Emini futures candlestick chart this week was a bear bar. This is bad follow-through after the breakout above a three-month triangle.
The weekly S&P 500 Emini futures candlestick chart broke above a three-month triangle two weeks ago, but this past week was a bear bar. That lack of follow-through buying reduces the chance that the breakout will be successful. Fifty percent of triangle breakouts fail.
The bears see this week as a sell signal bar for a failed breakout. Since the bar is not big, it is not a strong sell setup. The probability still slightly favors the bulls. The bulls need follow-through buying this week. If they fail to get it, the trading range is likely to continue.
Alternatively, if the bears get a big bear bar this week, then the bull breakout will have failed. The weekly chart would then either stay sideways or continue to fall and have bear breakout.
Daily S&P 500 Emini futures candlestick chart:
Emini weak bull flag after breakout above April high
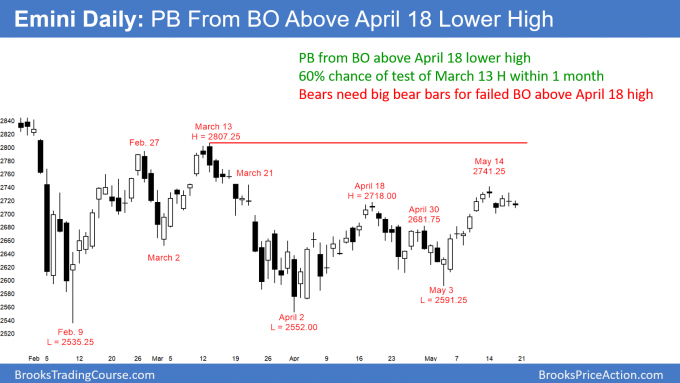
The daily S&P 500 Emini futures candlestick chart pulled back this week after a breakout above the April 18 major lower high. The bears have a micro double top, but the four-day tight trading range is more likely a bull flag.
The daily S&P 500 Emini futures candlestick chart has been oscillating around the April 18 major lower high for seven days. The bulls need follow-through buying this week. Since the rally from the May low was strong, the odds favor at least slightly higher prices this week.
However, the bears see Friday as a second entry short for a failed breakout above the April 18 lower high. If they get two big bear trend days this week, they will probably get another test back down to the bottom of the four-month trading range.


