Internal market slippage has been ongoing. The inability of S&P 500 (SPX), key primary indicator of market action, to move forward after rising above the declining-tops pattern was anticipated, writes Gene Inger over the weekend.
It forces analysts and a slew of money managers to deal with considerations of what comes next.
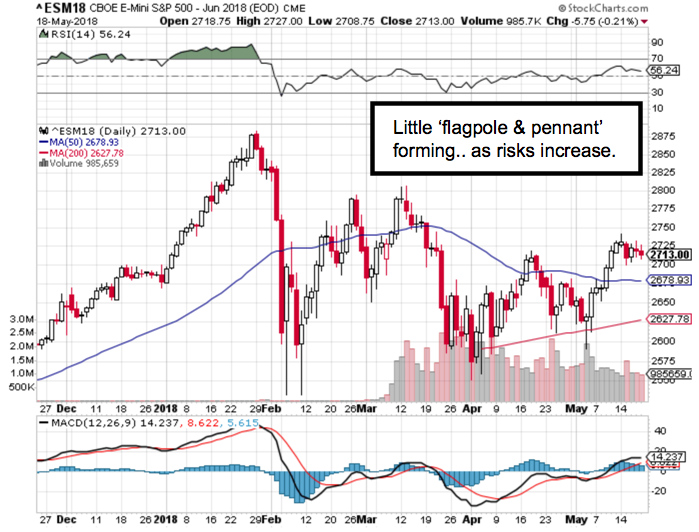
Generally, they won’t reflect on the preceding break of the S&P 200-day moving average. It was the first time this year.
Reuters: Trade war truce spurs Dow higher and Russell 2000 to record Monday. Dow Jones Industrials (DJI). Russell 2000 (RUT).
They valiantly used leverage to trigger short-covering comebacks. They not only continued a string of requisite snap-backs expected in a ragged Spring, but in this case was the most desperate Hail Mary of the several thrusts.
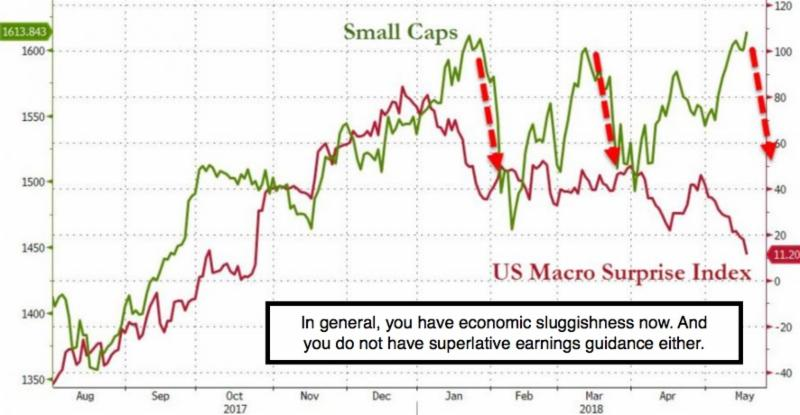
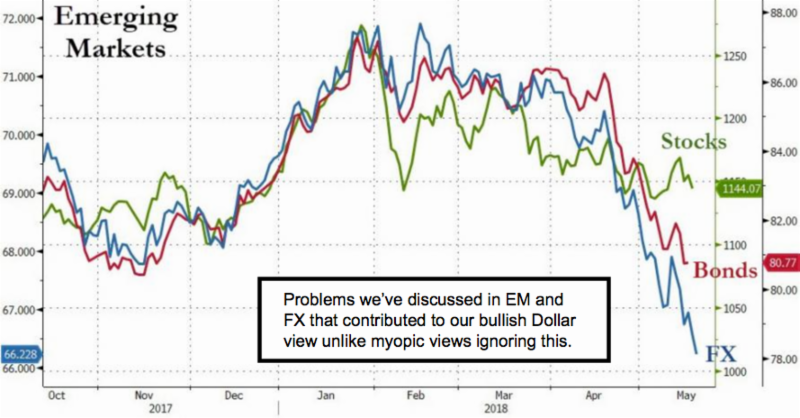
Basically, it looks exhausted. It’s not moving much because of trade talks. It is not impacted much by Middle East or China-Taiwan tensions; nor is it willing to accept that Emerging Markets jitters and economic slippage in a sense relate to EM forex liquidity drying-up, and is clearly a part of why the dollar has been stable-to-firm as we’ve called for months.
This Bull/Bear (strange combined animal) struggle isn’t the only matter at hand as many think. (An extension of market move versus a decline?) One should ponder whether a bigger concern is simmering out there but not yet at a boiling point.
That means all the chatter about buying or not buying or technical levels in the near-term could mask a macro concern we’ve noted and that’s global debt, not just our domestic debt issues that are frequently topical.
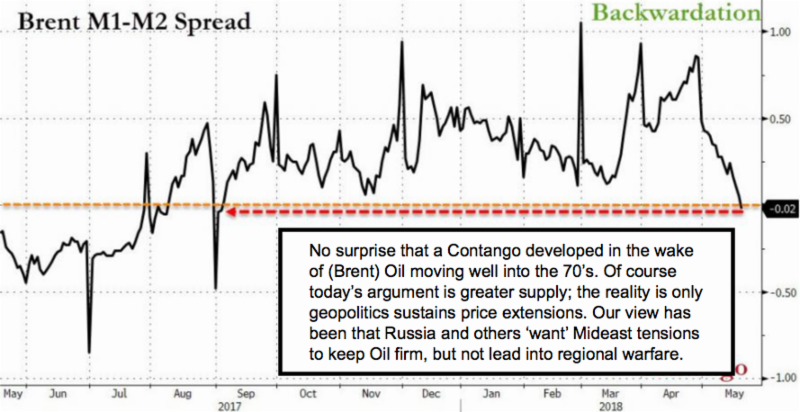
Russia and Iran and possibly China are discussing oil transactions in euro (USD/EUR) rather than dollars could relate to this. It’s really is a function of recent slippage, which we forecast for forex currencies, and their desire to circumvent risk of capital being tied-up due to sanctions if they trade other than in dollars.
I nevertheless wonder if some other approaches are attempts to fend-off a slew of risks. (This might even relate to the hiding and corruption aspects of cryptocurrencies hoping they won’t suffer fates similar to oft-depreciating currencies in a crisis.)
The point is that some sort of Emerging Market debt default is a risk over the coming year or so and must be monitored.
Notice I didn’t mention the U.S. debt picture in this context. As risky as our ballooning debt is relative to growth, it’s nowhere near the worst levels. (There is no big U.S. infrastructure bill at-hand unfortunately. That too is a restraint on markets going forward relative to many earnings areas as a return to somewhat status-quo seems to exist among politicians.).
 ;
;
Risky as it is, U.S. debt-to-GDP ratios and so on do not approach what’s so evident overseas. And if we get a global crisis the dollar might not fold as so many pundits call for, but spike higher at that time. Lending on a broad front might be curtailed sharply, regardless of prevailing loan rates.
A resulting political and market backlash would be part of the woes; with a dramatic reversal of investor mood, which really isn't quite exuberant now despite the hold the course admonitions and grossly overoptimistic stock market rationalizations.
But this is for the future and we think strong dollar action is just a hint of what may be lurking around the bend. Incidentally, if it does occur, it’s not necessarily bearish for the United States aside the immediate market reaction. Our posture beyond crisis might brighten.
In-sum: What this boils down to for now is a market still fighting the Fedregardless of domestic debates about growth versus mild sluggishness.
The market is viewing trade as well as tariff talk of disappointment or concessions with actually sober skepticism of alternating stories involving China. Most accept it as part of negotiating, or efforts to reach some face-saving deal for the two sides. Ultimately, we’d expect uninspiring but acceptable resolutions.
Subscribe to the IngerLetter here