
In Higher-Risk Asset Classes, there are very few opportunity areas if markets point up: Eurozone Financials (EUFN), Dow Industrials (DIA), Emerging Markets (EEM), U.S. Banks (KBE) – all of which are relatively cheaper, says Ziad Jasani in video and commentary Sunday.

View my market strategy session video May 18
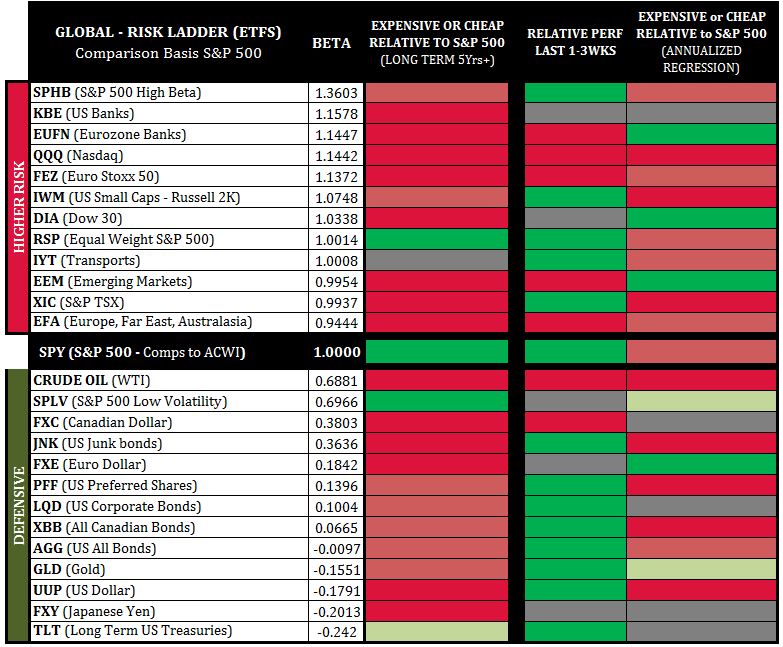
Global risk sentiment: Looking at the third column to the right on the chart we see a comparison of higher-risk asset classes and defensive asset classes back to the S&P 500 (SPY) on an annual basis.
When we see more green above the SPY-line (middle line) and more red below we have a general “Risk-On” signal; and vice-versa (red above, green below would be “Risk-Off”).
Currently, we have a highly mixed posture with a “hair-of-a-lean” to risk-on.
Defensive asset classes present as neutral to expensive, save for the Euro (FXE), Gold (GLD) and Low-Volatility (SPLV), which present as cheap.
Higher-risk asset classes are polarized with the TSX (XIC), Russell 2000 (IWM), Nasdaq (QQQ), Transports (IYT), Hi-Beta (SPHB) and Eurozone (EFA, FEZ) presenting as expensive while the rest presents neutral to cheap. This implies that very few opportunity areas remain if markets point up: Eurozone Financials (EUFN), Dow Industrials (DIA), Emerging Markets (EEM), U.S. Banks (KBE) – all of which are relatively cheaper due to under-performance driven by trade war issues, geopolitical risks, rising yields and mini-crises in EEM currencies.
This week’s reading should be seen as a caution or yellow light signal wherein a very short-term bounce could still occur or an abrupt red light signal presents.
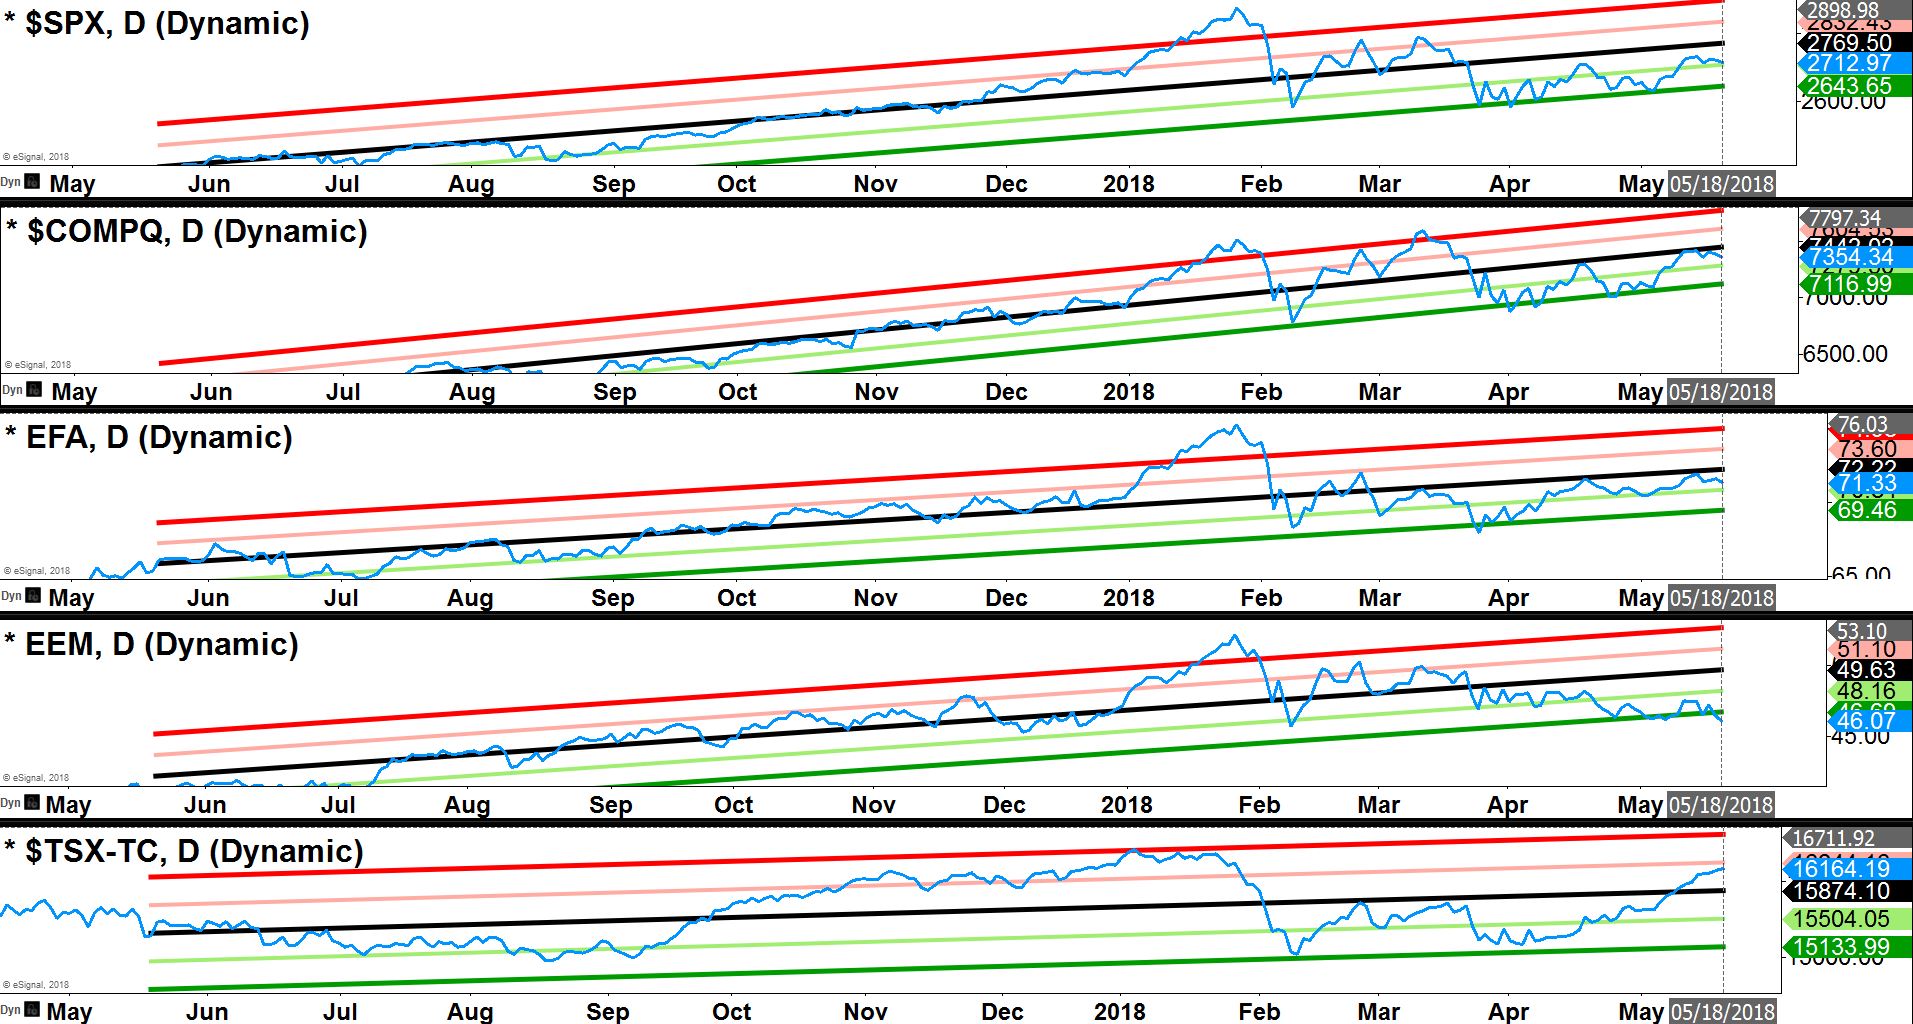
Major index direct price regression: When humans move very far away from normal routines they tend to come back home. In markets, we call this mean-reversion.
Currently, every major trading bloc presents ~2 standard deviations away (near the green line or cheap) from their normal annual routines (black line in channels). The current reading supports the May 3-4 macro market swing-low formation advancing but a further pause and slight price weakness before the next leg higher would be fair-game in the week ahead.
Closing the week above “home” (black center channel lines) would imply bullish-continuation; closing below would imply a re-trace to recent lows (200-day moving average S&P 500) or lower.
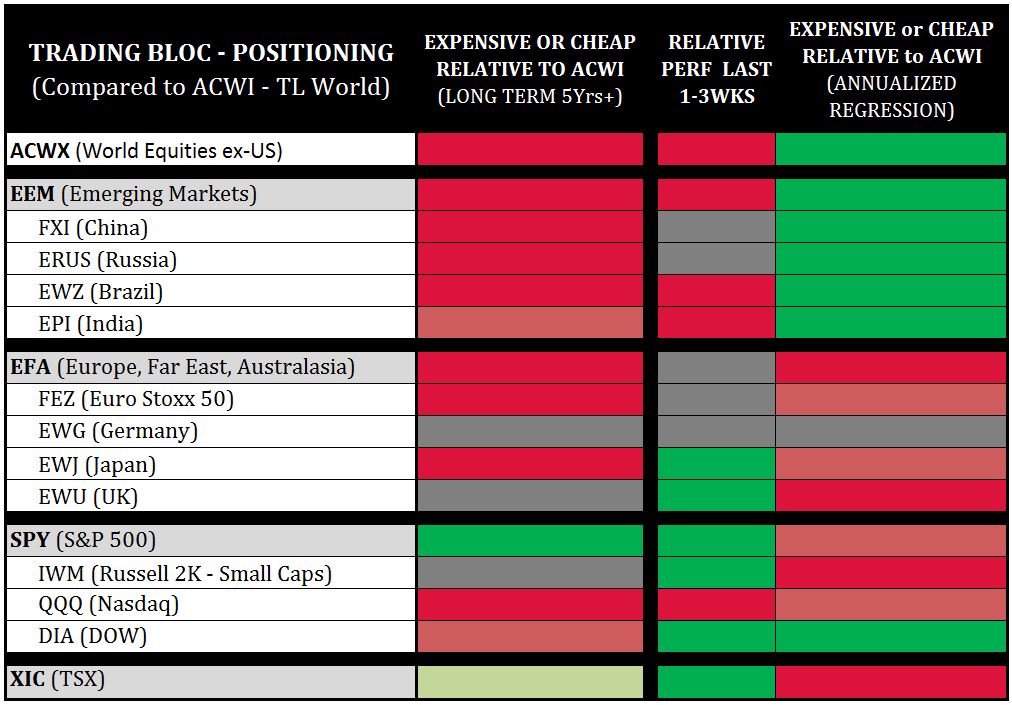
Trading bloc positioning: This chart compares major trading tlocs back to the entire global equity market (ACWI), to determine which spaces are relatively cheaper.
Why? Capital flows usually tilt towards relatively cheaper spaces, especially if a macro market swing-low formation takes hold.
US Markets (S&P 500 SPY, Dow DIA) present as the strongest opportunity areas, followed by Emerging Markets (EEM), China (FXI), India (EPI) and Brazil (EWZ).
The TSX presents as 2 standard deviations expensive, which implies that if the macro market swing-low advances this week the TSX is likely to under-pace the world; or if prices turn down, the TSX is likely to move down at a faster pace.
Since the late-January 2018 correction we are in full swing-trading mode with our short-to-mid-term capital and remain Hold with our longer-term holdings, while the S&P 500 > 200-day moving average.
View the Independent Investor Institute trading ideas and strategies videos here.


