
The St. Louis Fed estimate for Q3 is also bearish as it expects GDP growth to be 2.38%. That estimate might end up being valid because I expect growth to slow in the second half, writes Don Kaufman Saturday.
The stock market fell slightly even though Microsoft (MSFT) reported great earnings. The S&P 500 (SPX) was down 0.09% and the Nasdaq (NQ) was down 0.07%. Microsoft stock was only up 1.79% as it gave back much of its morning strength. I expect the stock to continue making all-time highs this year as the business has strong momentum.
Consumer staples was the best sector as it was up 0.59%; the worst sector was real estate which was down 0.92%.
The stock market was up 2 basis points on the week as the slight sell offs on Thursday and Friday eliminated the gains. With the sideways action, the CNN Fear & Greed Index is at 54 which is neutral.
The elimination of volatility in July continued as the S&P 500 traded in a 0.98% range last week which was the smallest of the year and the 25th smallest of this bull market. If the market would have been up a bit on Friday, this would have been a typical week in 2017.
Sharp Treasury sell off
I was wrong, at least in the short term, on the Treasury market as there was a sharp selloff in long bonds. The 10-year Treasury was up 5.51 basis points to 2.8931%. The 30-year Treasury yield was up 6.73 basis points to 3.0258%.
The 10-year has broken out of that technical box it was in. This doesn’t necessarily mean it will keep moving up. The 2-year yield was flat as it was up only 0.24 of a basis point to 2.5931%. This means there was a very sharp steepening in the yield curve. The difference between the 10- year yield and the 2-year yield is now 30 basis points exactly.
In the grand scheme of things when you take a step back, this isn’t a massive move, but it’s always worth trying to figure out why sizable daily moves happen.
This could’ve been a trend correction. There wasn’t any economic data to support the notion that growth or inflation are picking up. Maybe the earnings growth and pick up in capex spending inspired investors to sell the long bond.
Decent retail sales report
Because of the plethora of earnings reports, I haven’t reviewed much of the economic data last week. I will review the June retail sales report which came out last Monday (July 16) now. The results came mostly in line, but growth was lower than last month. May’s report was revised sharply higher. Month over month retail sales were up 0.5% which met estimates.
May’s reading was up 1.3% instead of the initial reading of 0.8%. Retail sales excluding autos were up 0.4% which met estimates. May’s growth was revised from 0.9% to 1.4%.
Excluding autos and gas, monthly sales were up 0.3% which missed estimates for 0.5%. May’s sales growth was revised from 0.8% to 1.3%. Finally, the control group saw no growth which missed estimates for 0.4%. May’s control group growth was revised from 0.5% to 0.8%.
Since those were all month over month numbers, it’s not fair to say this was a disastrous report. It just wasn’t amazing like May. Then again, it can easily be revised higher like May’s report was.
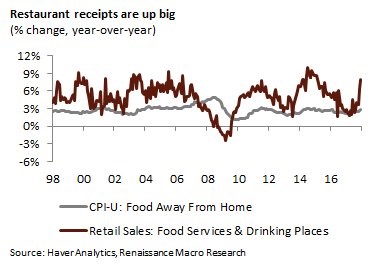
Auto sales were strong in May and June as growth was 0.8% and 0.9%. Restaurant sales have been up dramatically in the past two months as growth was 2.6% in May and 1.5% in June.
The chart below shows the year over year growth in the food services and drinking places category has increased dramatically. Growth was 8% in June. It’s up much faster than the CPI-U report which measures prices for food away from home.
Health and personal care stores saw sales increase 2.2%. E-commerce sales were up 1.3%, which means it took share from brick and mortar stores. It was up 10.2% year over year. The latest data on e-commerce sales as a percentage of total retail is from Q1. E-commerce was 9.46% of retail.
The chart of e-commerce looks just like the Amazon (AMZN) stock chart. I can’t see why it can’t get to 20% in a few years. Gasoline store sales were up 1% in June and 3% in May. That’s mostly because of high oil prices.
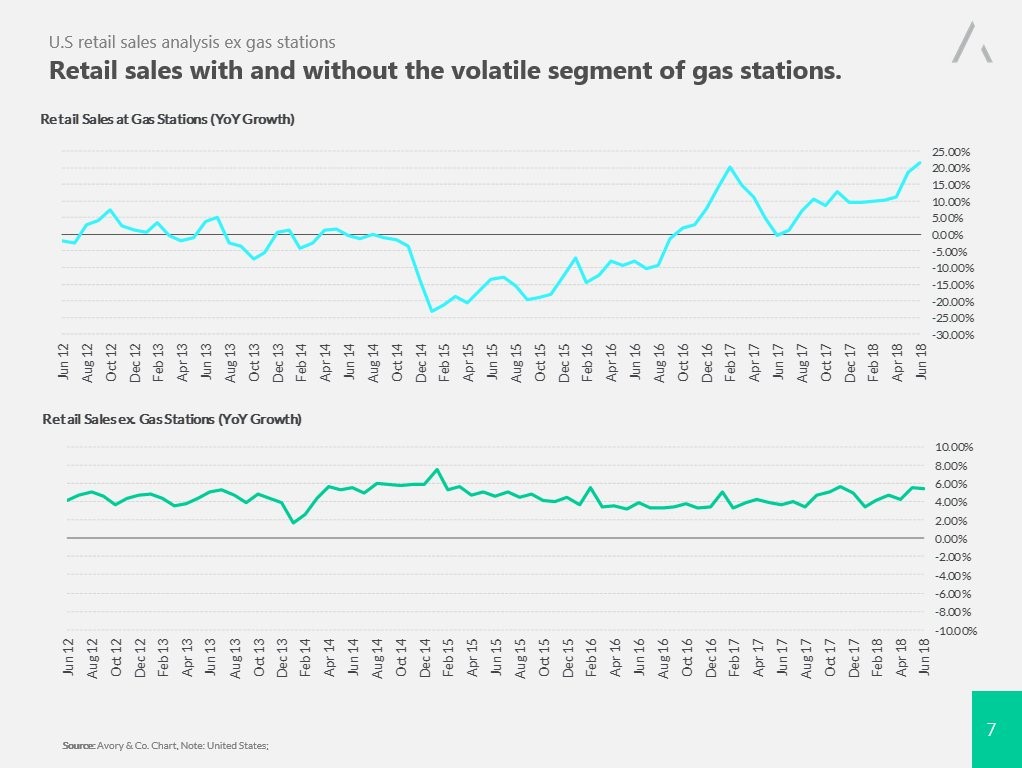
The charts below show retail sales without gas stations and at gas stations alone on a year over year basis. As you can see, retail sales at gasoline stores were up 21.56% on a year over year basis. Retail sales excluding gas stations have been very consistent as they never even flinched during the mini recession from 2015-2016.
Building materials sales were up 0.8% and furniture stores were up 0.6%. The only two categories with declines on a year over year basis were department stores and sporting goods stores as they were down 0.03% and 4.74% respectively.
GDP growth estimates
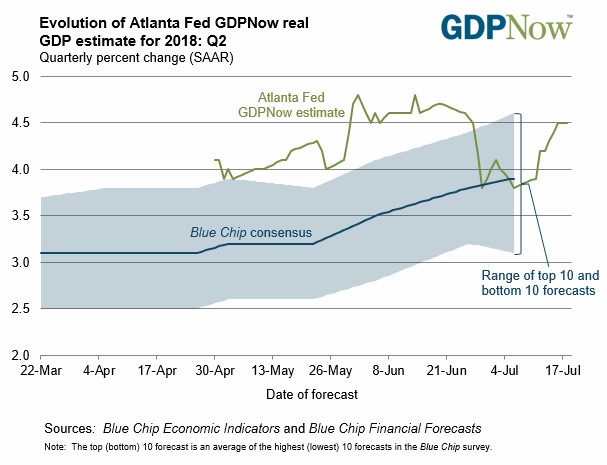
The GDP report comes out next Friday. The current consensus is for 4.2% growth as the estimates have ramped slightly in the past two weeks because of strong data. The consensus for real consumer spending growth is 2.9% which is over triple last quarter’s growth rate. I will be reviewing more of the data from this week in next week’s articles to fill in the gaps, but for now let’s look at the GDP estimates from the Fed models.
As you can see from the chart below, the Atlanta Fed model is estimating growth will be 4.5%. The model is expecting high growth even though it expects real residential investment growth to be 0%. Its final estimate before the GDP report will be on Thursday.
The St. Louis Fed is much more bearish as it expects 3.37% growth. The penultimate Nowcast from the NY Fed is completely off as it expects 2.69% growth which is the lowest estimate it has come out with. The housing starts and building permits reports caused it to go down 0.11% this week.
Subscribe to TheoTrade here...
View a brief video interview with Don Kaufman on volatility for traders and investors here
Recorded at TradersExpo New York Feb. 25, 2018
Duration: 2:34.


