
The hotly anticipated GDP report came out on Friday; it showed growth was extremely quick in Q2. Quarter over quarter GDP growth was 4.1% which missed estimates for 4.2%, writes Don Kaufman Saturday.
The information provided on Q2 was actually the least interesting part of the data set. The most interesting part was the revisions to the data. A lot of what we thought to be true before this report has now changed.
Firstly, the GDP growth in Q1 was revised back up to 2.2%. The GDP price index was revised from 2.2% to 2%. The real consumer spending growth was revised even lower to 0.5% from 0.9%. It was a weirdly terrible consumer spending growth rate amid a solid run of economic growth since mid-2016.
Secondly, there was a big increase in previously unreported income that changed the savings rate for the past few decades. You can see in the chart below the blue line, which is the updated savings rate, is much higher than the red line, which is the previously reported data. The bears have obsessed about the low savings rate for the past few quarters. Now they find out, the consumer isn’t running on empty. The consumer has deleveraged this cycle as the housing bubble has burst and incomes have increased.
With a higher savings rate, the business cycle isn’t as close to ending as it once appeared.
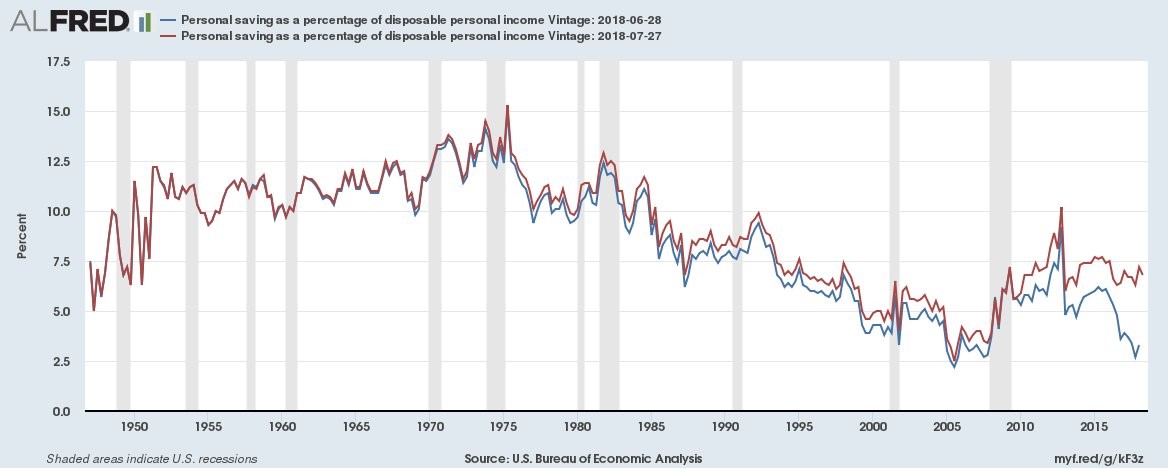
The change in the rate was caused by the comprehensive revision to the GDP report. These revisions occur every five years. This one was major as proprietor’s income was moved $401.9 billion higher in 2017, which was a 2.4% increase. It was moved up $196.4 billion in 2016 and $166.7 billion in 2015. This pushed the savings rate to 6.7% from 3.4% in 2017 and to 6.7% from 4.9% in 2016. This makes sense to me because, as I said earlier, households have much less leverage than last cycle.
The changes to past GDP reports were made because the seasonal adjustments were altered. The 2017 GDP growth rate was revised up from 1.2% to 1.8%. There have been a few terrible growth quarters to start the year which have shocked economists.
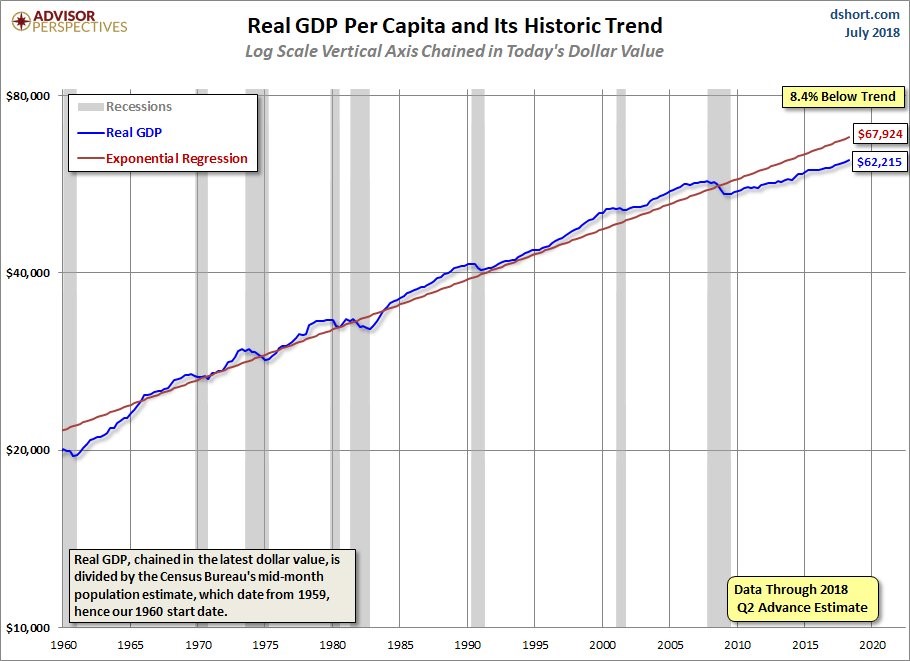
Now we find out the data wasn’t correct. In Q1 2016, GDP growth was revised from 0.6% to 1.5%. Even with all these changes, the average growth rate in this expansion stood pat at 2.2%. The average growth rate from 1929 to 2012 stayed at 3.2% and the growth rate in the last cycle was changed from 2.8% to 2.9%. As you can see from the chart below, the slow growth this cycle has caused the overall GDP to be 8.4% below where it would be if it followed the trend.
Specific Q2 numbers
Getting back to the Q2 results, the GDP price index increased from 2% to 3% as inflation accelerated. The consensus was for 2.2% growth, meaning it handily beat what economists thought would occur. The core price index was also strong as it came in at 2.7% which was above last quarter’s 2.4%. Real consumer spending growth was up dramatically from Q1 as it went from 0.5% to 4%.
Consumer spending contributed 2.7 points to the GDP growth with spending on services helping 1.5 points and spending on goods adding 0.6 points. That spending on goods was split evenly between durables and non-durables. Net exports helped GDP by 1.1 points as exports increased much faster than imports.
To be clear, this isn’t because of Trump’s trade actions. Non-residential investment helped GDP by 1 point (led by intellectual property and structures) and government purchases added 4 tenths of one point.
Inventories dragged GDP growth as they fell $27.9 billion which hurt GDP by 1 point. Excluding inventories, GDP growth would have been 5.1%. In the next few quarters when GDP growth is likely helped by an increase in inventories, the bears will likely claim that the growth isn’t real. If that’s the case, then growth was actually 5.1% this quarter. Any headline that said the stock market was disappointed by this report because it fell was incorrect.
This was a great report as evidenced by the decline in inventories; stocks fell because they were overbought.
GDP accelerated
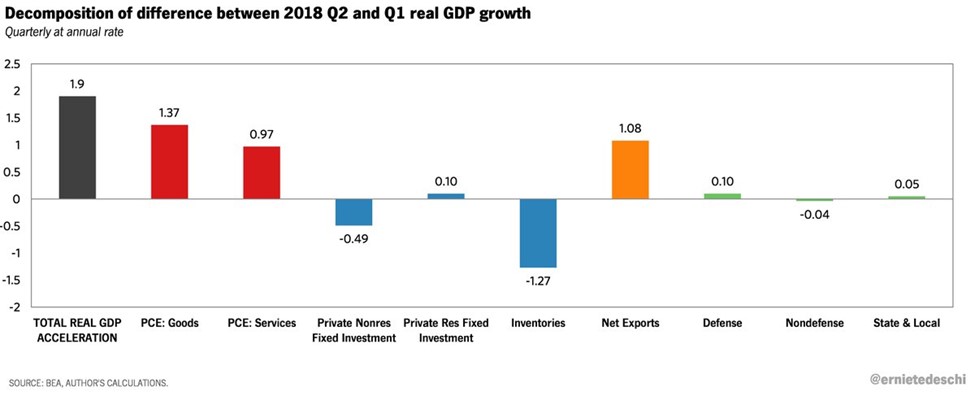
The chart below breaks down the causes of the 1.9% GDP growth acceleration from last quarter. As you can see, net exports were a big reason for the increase, while private non-residential fixed investment was only up 0.1%. Inventories were a 1.27% drag on GDP. As I mentioned, this is great news because it signals inventories need to be rebuilt, pushing up future GDP growth. PCE goods had a 1.37% positive impact and PCE services had a 0.97% impact.
Who was correct?
The NY Fed Nowcast was completely wrong as the growth was expected to be 2.78%. The Atlanta Fed Nowcast was close as its estimate was 3.8%. The St. Louis Fed’s estimate of 3.37% was far off.
It’s interesting to see how they all were too negative. The CNBC rapid update was exactly correct as the average estimate was 4.2% and the median estimate was 4.1%. The Oxford Economics estimate of 4.5% was too high.
Q3 estimates
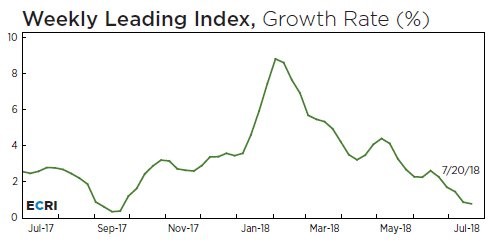
The NY Fed’s Q3 Nowcast was increased from 2.38% to 2.83% on Friday. The data last week was really great as I mentioned. The biggest help to the estimate came from the inventories report and the durable goods report. The ECRI leading index is dramatically more pessimistic than the NY Fed Nowcast. I trust the leading index more because the Nowcast is only using the current data. If the data weakens like this index expects, the Nowcast’s estimate will fall. The Nowcasts aren’t accurate in the beginning of the quarter. As you can see from the chart below, the leading index’s year over year growth rate has fallen to 0.8%. It is getting close to the near zero growth rate seen in September 2017.
Subscribe to TheoTrade here...
View a brief video interview with Don Kaufman on volatility for traders and investors here
Recorded at TradersExpo New York Feb. 25, 2018
Duration: 2:34.


