
In The Playbook from Gravitational Edge on July 18, we discussed that investors seem to have a consensus belief that both yields and inflation are pulling a “Superman,” and going up, up and away, writes Landon Whaley. Join him at MoneyShow San Francisco August 24-25.
We also said, “These consensus views are wrong, and we will be fading them in the weeks and months ahead.”
We expected inflation and yields to stay buoyant throughout the remainder of Q3 and begin slowing towards the latter part of the year, but it appears the timeline is speeding up a bit. We are already seeing a number of inflation and yield-sensitive U.S. asset classes starting to confirm slower inflation and lower yields.
Asset classes that historically exhibit a positive correlation to inflation and yields are breaking down:
- U.S. Oil and Gas Exploration stocks peaked on July 10, and have been making a series of lower highs, which is a bearish development. They are now down -8.8%.
- U.S. Financial stocks peaked on January 29, have been making a series of lower highs and are now down -5.3%.
- U.S. Basic Material stocks peaked on January 26, have been making a series of lower highs and are now down -5.9%.
- Crude oil peaked on May 22, has been making a series of lower highs, and is now down -5.6%.
On the flipside, asset classes that typically react bearishly to rising, or elevated, U.S. yields and inflation are breaking out to the upside:
- U.S. Utilities bottomed on June 7, have been making a series of higher lows (which is a bullish development) and are now up +10.7%.
- U.S. REITs bottomed on February 9, have been making a series of higher lows and are now up +17.6%.
- Long-dated U.S. Treasuries bottomed on February 21, have been making a series of higher lows and are now up +3.7%.
- U.S. Consumer Staples bottomed on May 3, have been making a series of higher lows and are now up +10.3%.
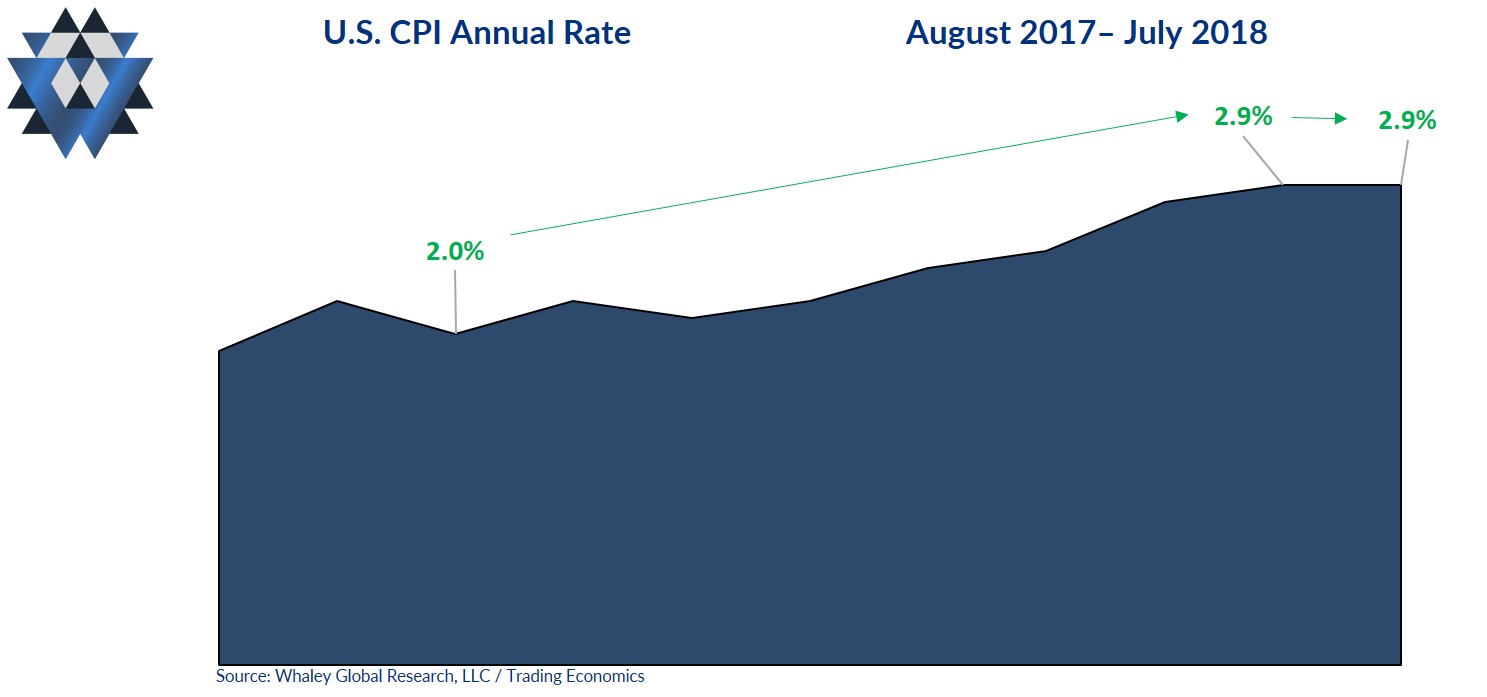
But it’s not just real-time markets front-running a shift in the direction of U.S. inflation and yields; the economic data itself is beginning to agree. Last week, we received the latest inflation readings across three primary gauges: Producer Price Index (PPI), core inflation, and Consumer Price Index (CPI). Both CPI and core inflation came in as we expected with CPI flatlining from the prior month (keeping the uptrend intact) and core accelerating for the third consecutive month to the highest level since 2008.
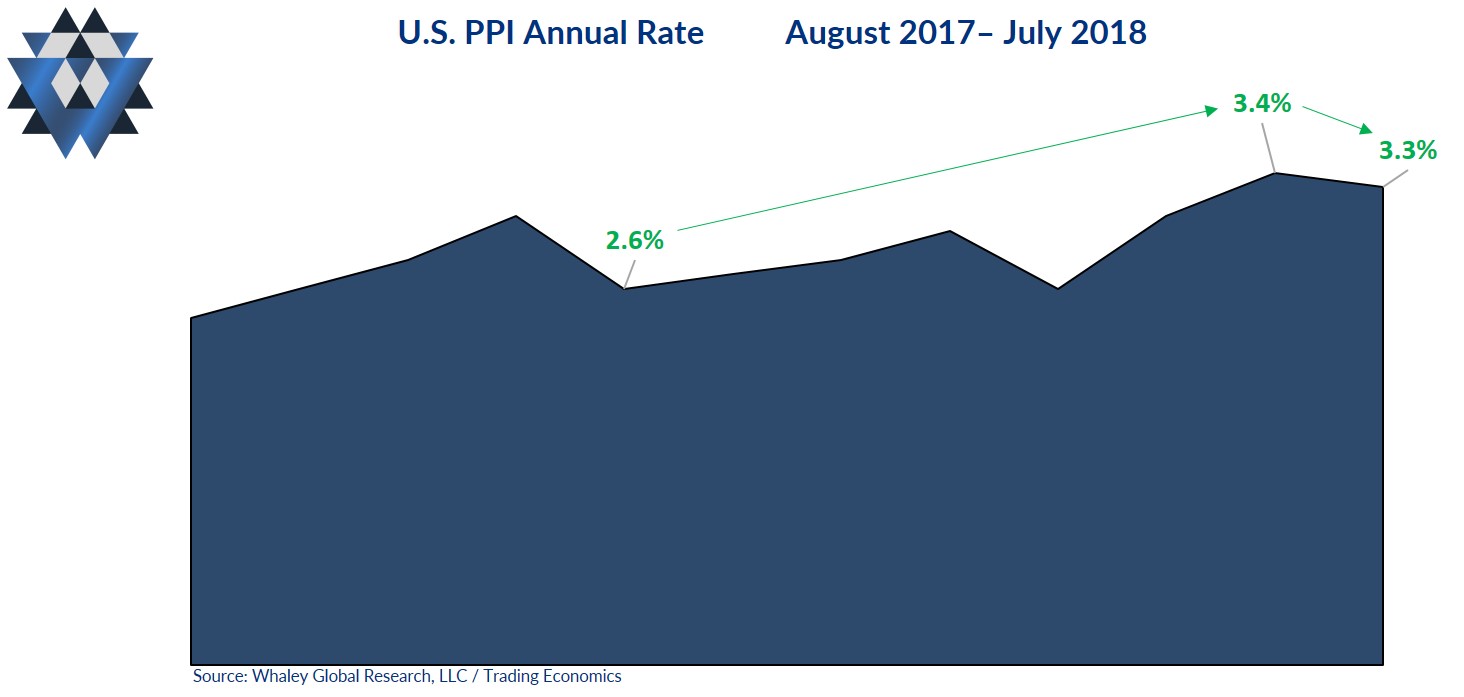
However, PPI was a different story.
One month after PPI hitting the highest rate in seven years, it slowed in July. Now, one data point doesn’t make a trend, but what makes this unexpected slowdown prescient is that the PPI inflation we saw at the tail end of 2017 was the highest in more than four years. This means it’s going to be very difficult for PPI data in the final five months of 2018 to “comp” against those inflation rates and accelerate.
The bottom line is that the most likely direction for PPI (and eventually core inflation and CPI) is lower.
Remember, the investing game is played in front of you, not behind. Being long asset classes that benefit from slowing inflation and lower yields (or being out of, or opportunistically short, pro-inflation asset classes) is about as contrarian as it gets right now.
But as is usually the case, the crowd won’t acknowledge this shift in the Fundamental Gravity reality until the markets and the data beat their portfolios over the head for months.
Please email us at ClientServices@WhaleyGlobalResearch.com if you’d like to participate in a an eight-week free trial of our research offering, which consists of three weekly reports: Gravitational Edge, The 358, and The Weekender.


